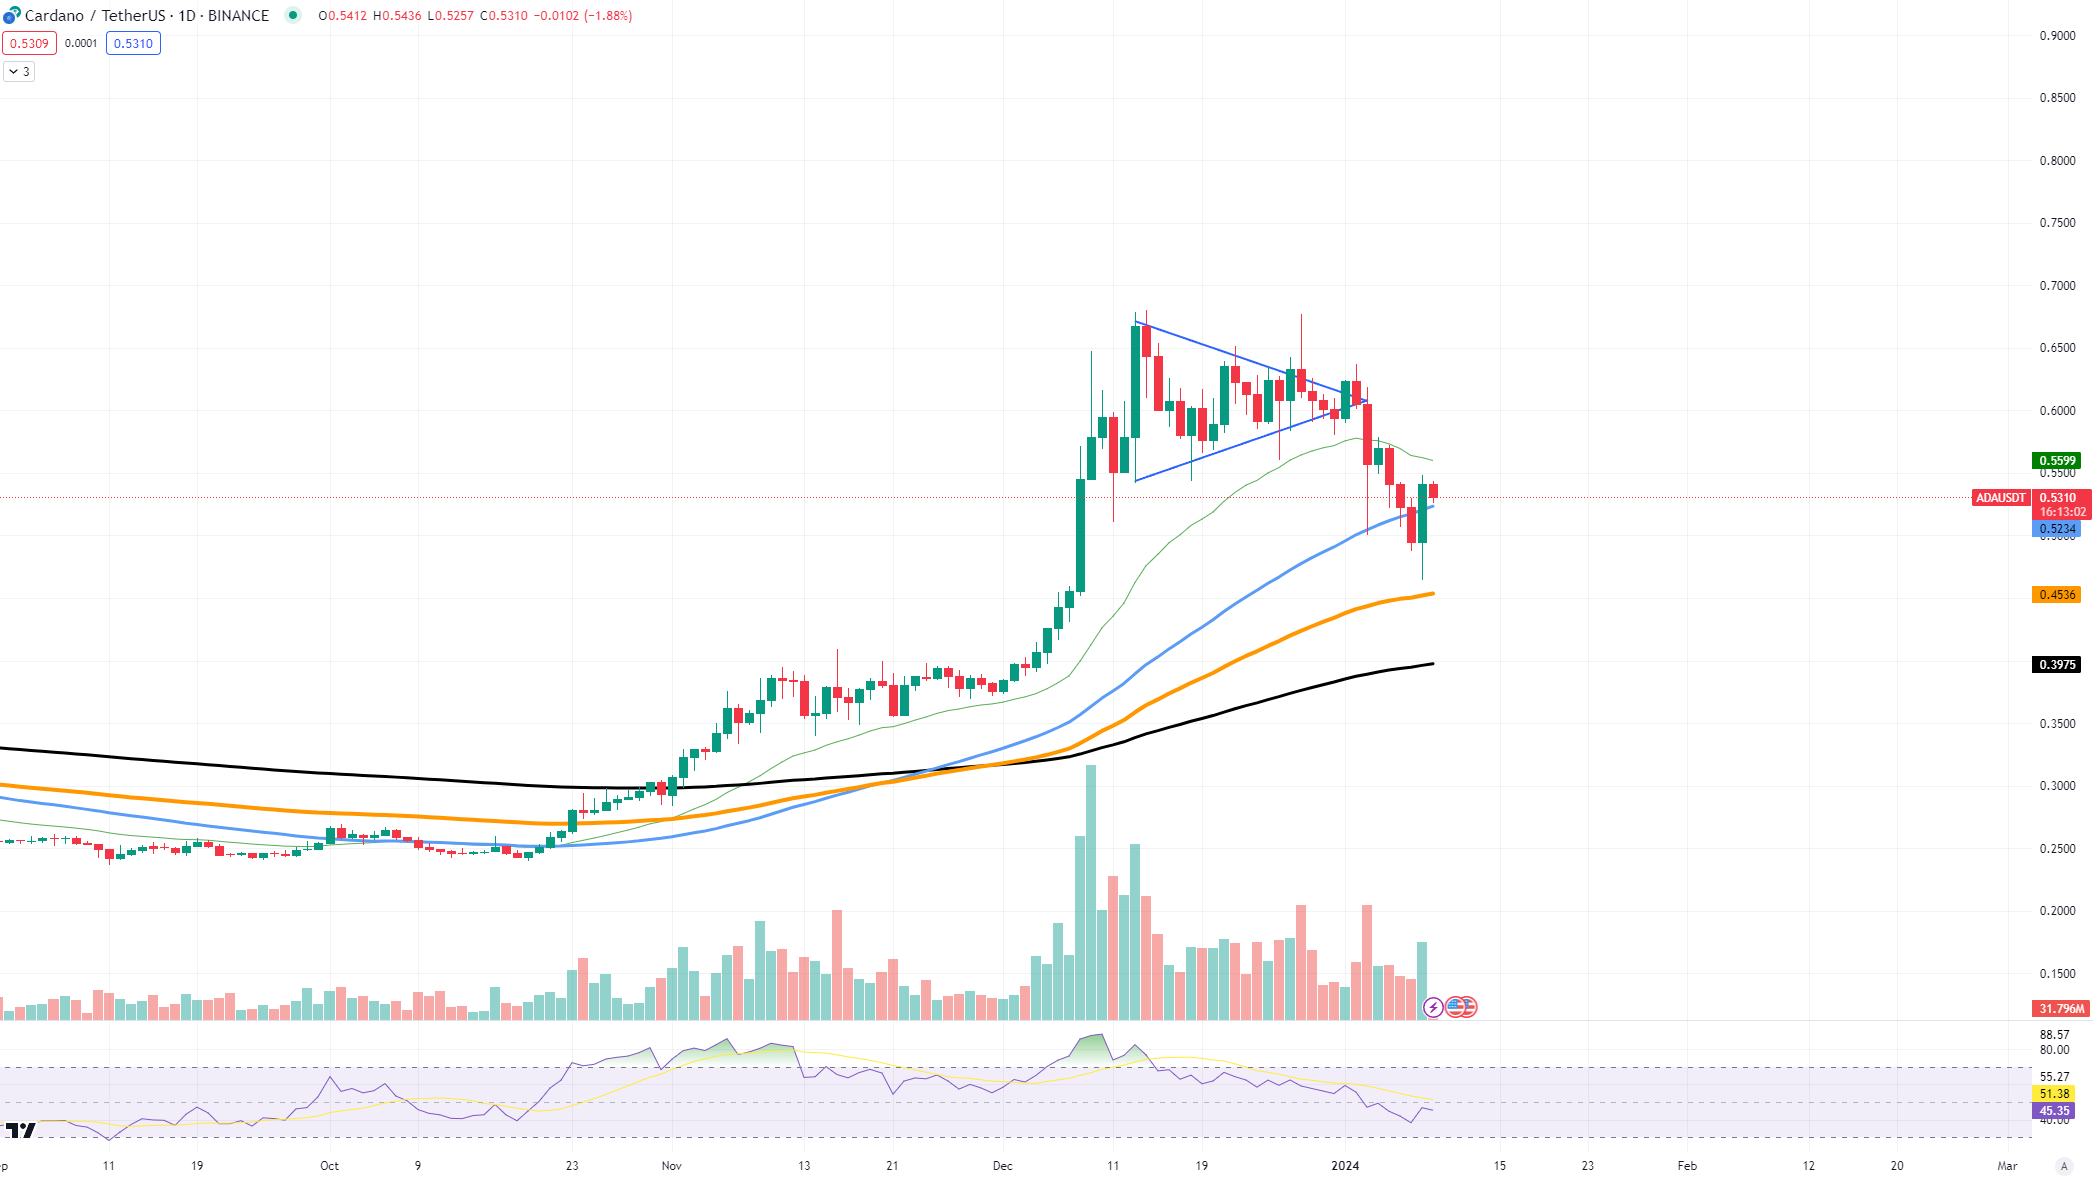
Cardano (ADA) has recently displayed a remarkable surge in its price action. The ADA/USDT chart indicates that Cardano has made a decisive move, cutting through the local resistance level marked by the 50-day Exponential Moving Average with convincing strength.
The breakthrough above the 50 EMA is significant, as this moving average often serves as a barrier that distinguishes bearish trends from bullish ones. Piercing through it typically suggests that the momentum has shifted in favor of the bulls. With this explosive move, traditional technical analysis would suggest that ADA is set to continue its upward trajectory, potentially forming new higher highs as it enters a bullish phase.

However, despite the strength shown in this recent price movement, there is a lack of notable long-term reversal signs. The Relative Strength Index (RSI), while recovering, is not yet indicating overbought conditions that would confirm a sustained upward trend. Additionally, the trading volume, although improved, does not show an overwhelming buy-in from the market that would support a robust long-term rally.
Fundamentally, Cardano's movements are still in lockstep with the broader market. Like many other cryptocurrencies, ADA's price action is influenced by overall market sentiment, macroeconomic factors and developments within the blockchain and cryptocurrency space.
While the recent technical breakout could excite short-term traders, long-term investors are likely looking for more substantial shifts in the market dynamics before confirming full-blown bullish mode.
Cardano's current position above the 50 EMA is a bullish signal for the asset, particularly in the short term. However, for a genuine long-term reversal to take hold, ADA would need to demonstrate continued strength and support from both volume and market sentiment.
 u.today