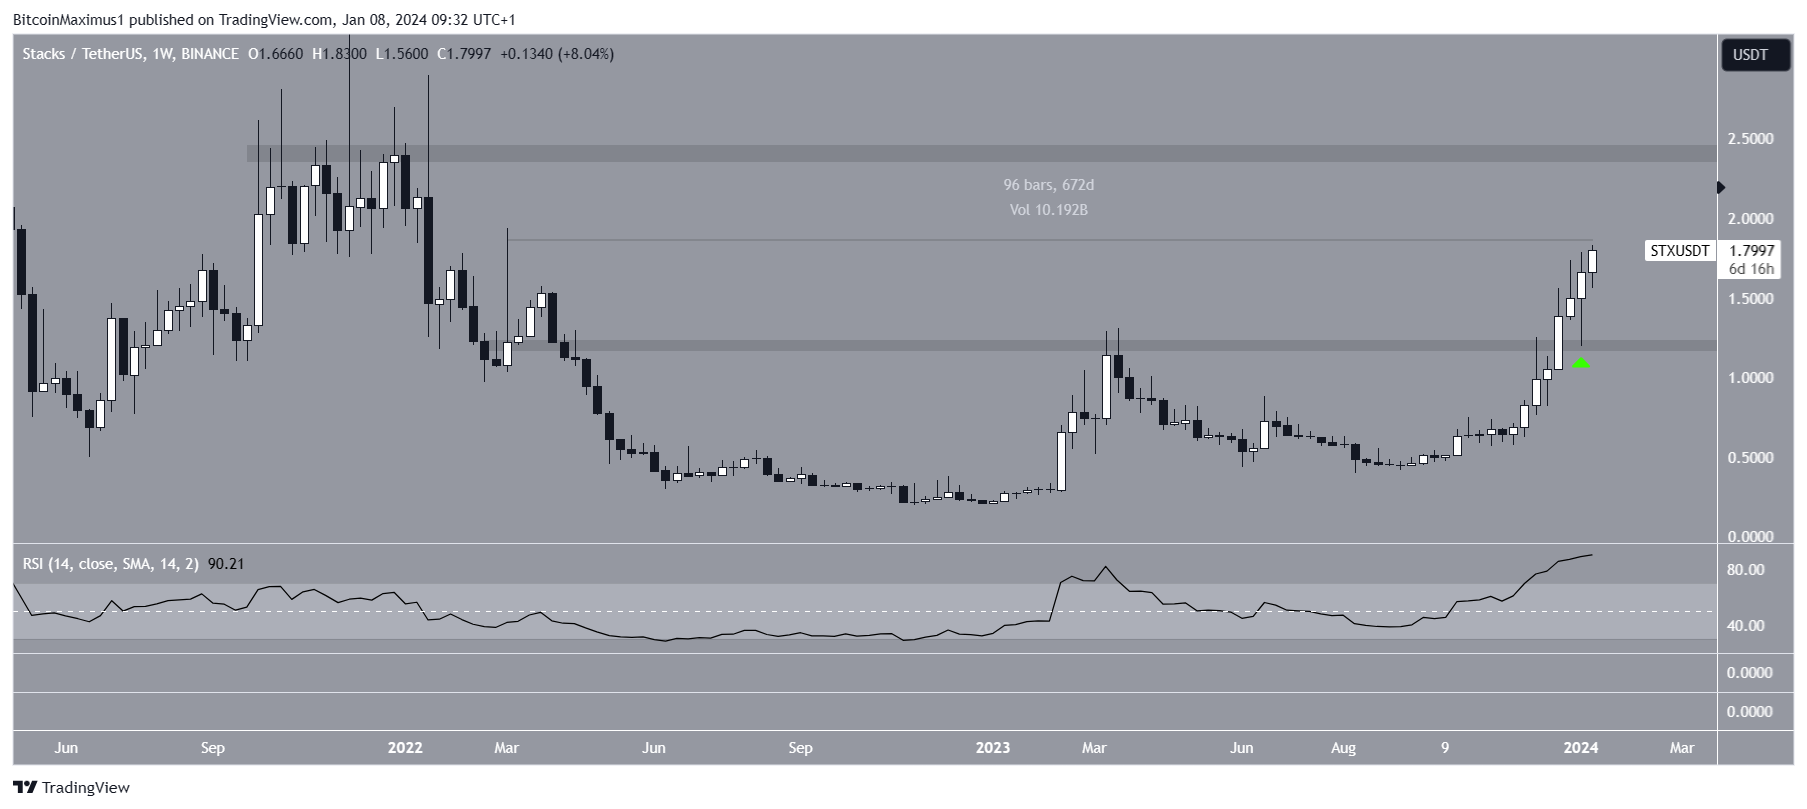
The Stacks (STX) price is moving above an important resistance area and is creating its eigtth successive weekly bullish candlestick.
The increase is in stark contrast to the altcoin market, which suffered a significant correction during the past three days.
Stacks (STX) Moves Above $1.80
The Stacks (STX) Price has increased significantly since the end of November 2023. The upward movement has been swift, with no pullback observed whatsoever.
Last week, STX experienced a flash crash, also seen in the rest of the cryptocurrency market. However, the price created a very long lower wick (green icon), validating the previous resistance as support. Then, it closed the weekly candlestick bullishly and resumed its increase this week.
So far, STX has reached a high of $1.83, the highest price since March 2023.

The RSI is a momentum indicator traders use to evaluate whether a market is overbought or oversold and whether to accumulate or sell an asset.
Readings above 50 and an upward trend suggest that bulls still have an advantage, while readings below 50 indicate the opposite.
The weekly RSI is increasing and above 50, signs of a bullish trend. Even though the indicator is in overbought territory, there is no bearish divergence to warn of an impending decrease.
For BeInCrypto‘s latest crypto market analysis, click here.
 beincrypto.com