Bulls have taken full grasp of markets today, with the global market cap sitting 6.4% above its previous 24-hour mark, as the total cap stands at $1.76T as of press time. The fear and greed index is 73, as more greed rains down the markets. The global trading volume is 41.5% up in 24 hours, at $65.8B as of press time.
Bitcoin Price Analysis
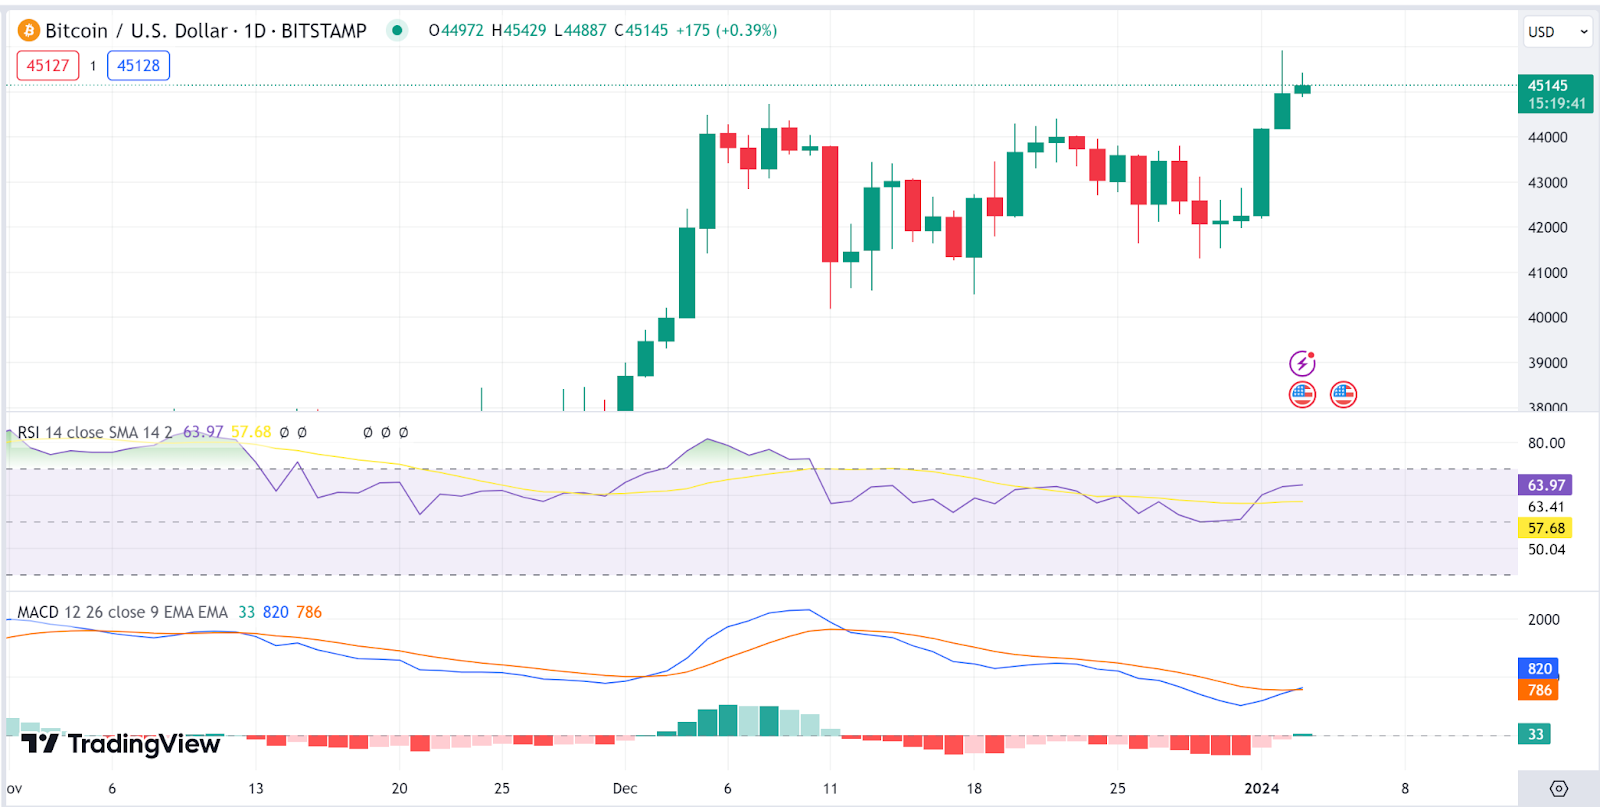
Bitcoin (BTC) is now facing corrections as the Bitcoin price stood at $45.1K as of press time amid yesterday’s rally, as it sits on a 24-hour drop of 1.3% and a weekly rise of 5.9%. As a result of the Bitcoin price, the token’s trade volume jumped by 1.68% during the same period and is presently at $30B.
The Relative Strength Index indicator is headed north as it approaches the overbought region, suggesting bullishness on the Bitcoin price despite today’s drop. The MACD indicator is also in the green zone, suggesting a bullish short-term on the Bitcoin price.
Ethereum Price Analysis
Ethereum (ETH) is also facing corrections as the Ethereum price stood at $2368 as of press time, as it sits on a 24-hour drop of 2.2% and a weekly rise of 5.2%. As a result of the Ethereum price, the token’s trade volume jumped by 25% during the same period and is presently at $11.4B.
The Relative Strength Index indicator is headed north as it crosses above 50, suggesting buying pressure on the Ethereum price despite today’s drop. The MACD indicator is also in the green zone, suggesting a bullish short-term on the Ethereum price.
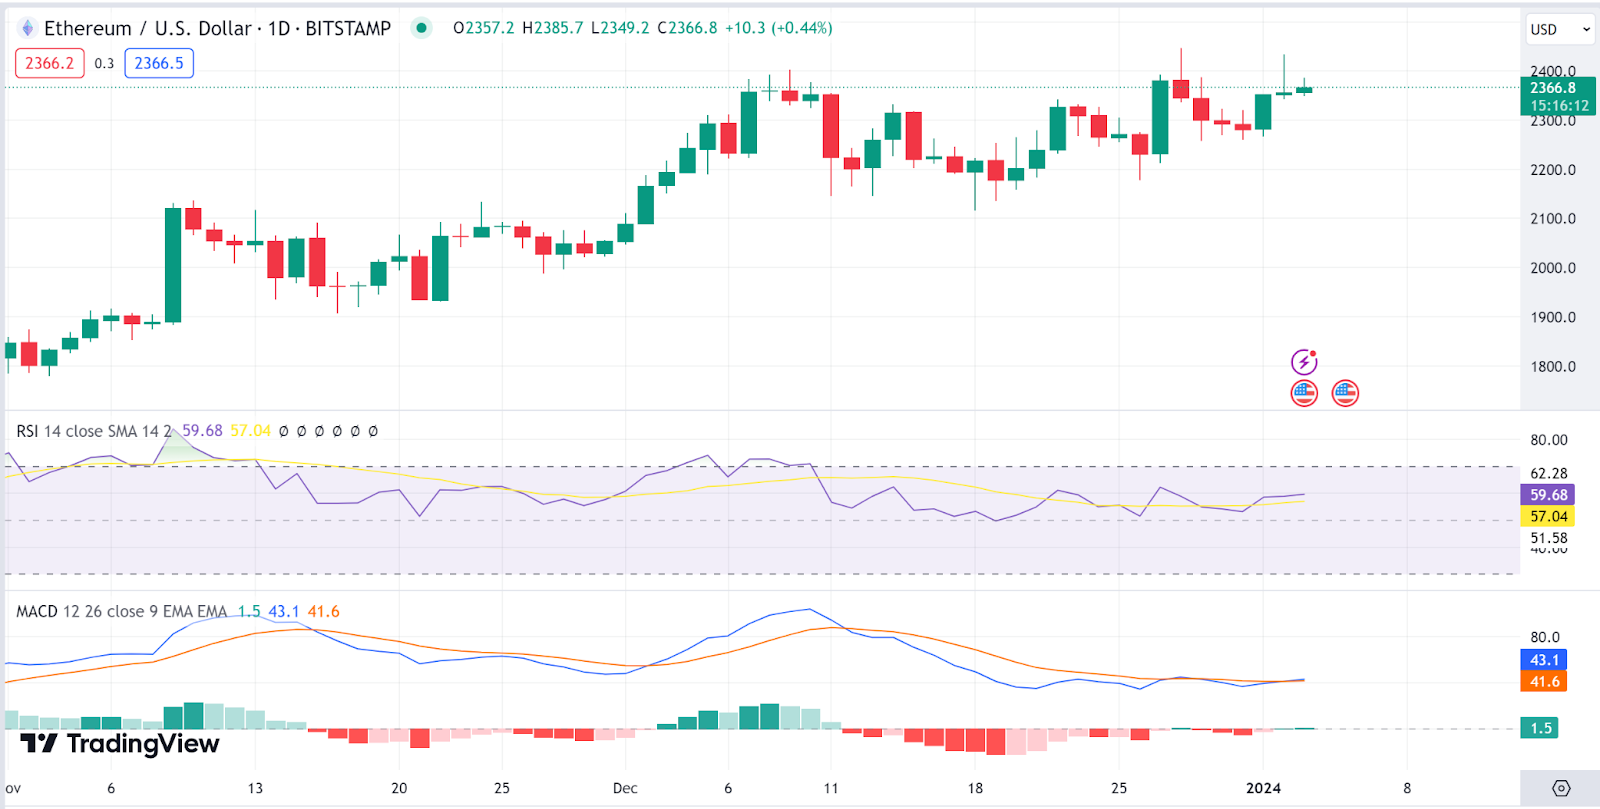
ETH 1-day chart | Source: TradingView
Arbitrum Price Analysis
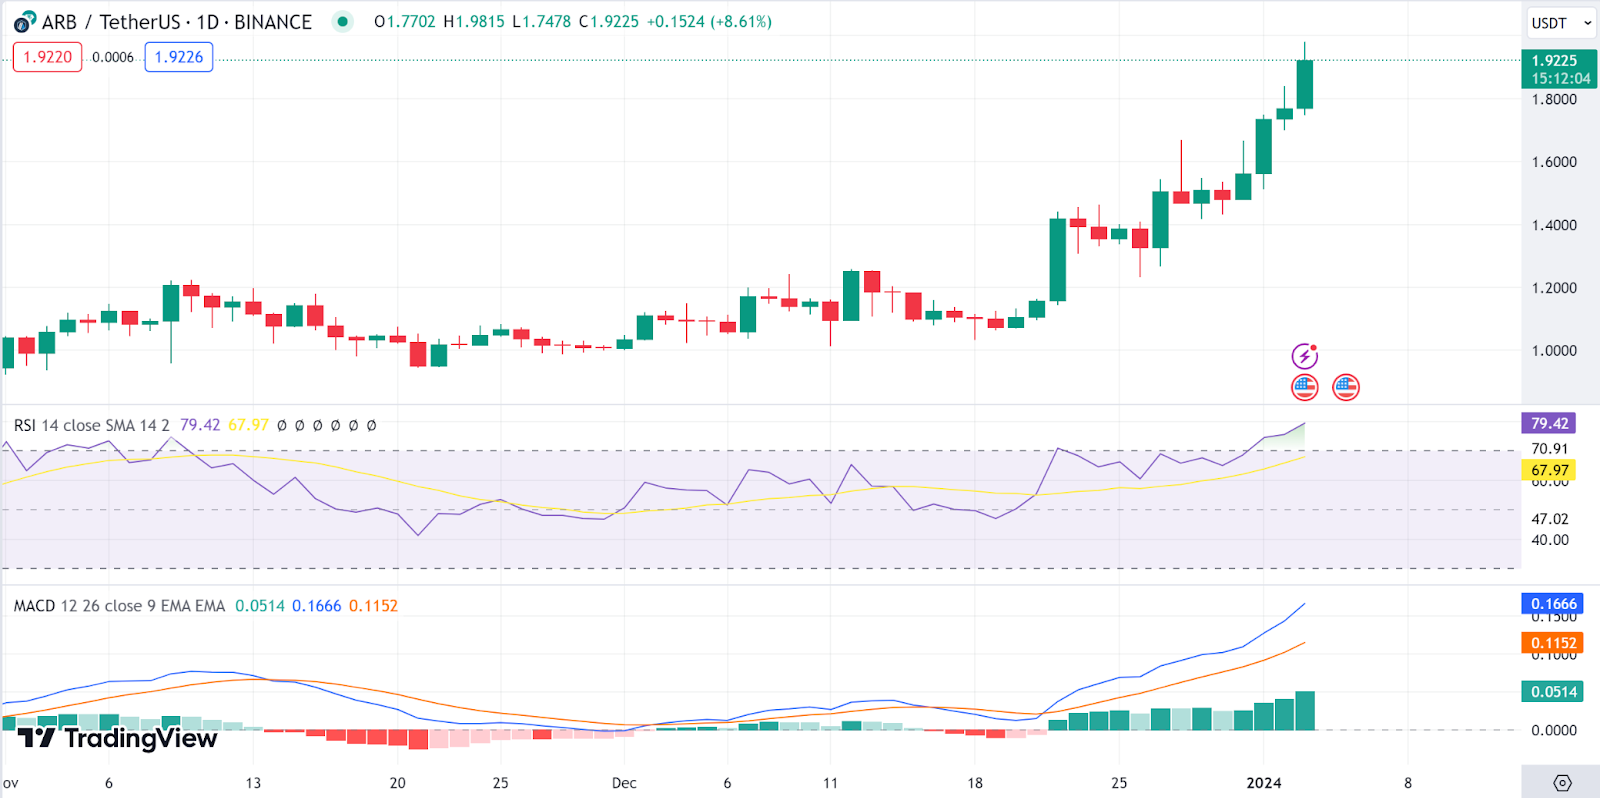
Arbitrum (ARB) is riding today’s bull wave as the Arbitrum price stood at $1.92 as of press time, as it sits on a 24-hour pump of 6.7% and a weekly rise of 45.8%. As a result of the Arbitrum price, the token’s trade volume jumped by 60% during the same period and is presently at $1.5B.
The Relative Strength Index indicator is headed north as it moves in the overbought region, suggesting bullishness on the Avalanche price. The MACD indicator is also in the green zone, suggesting a continuous pump in the short term on the Arbitrum price.
Sei Price Analysis
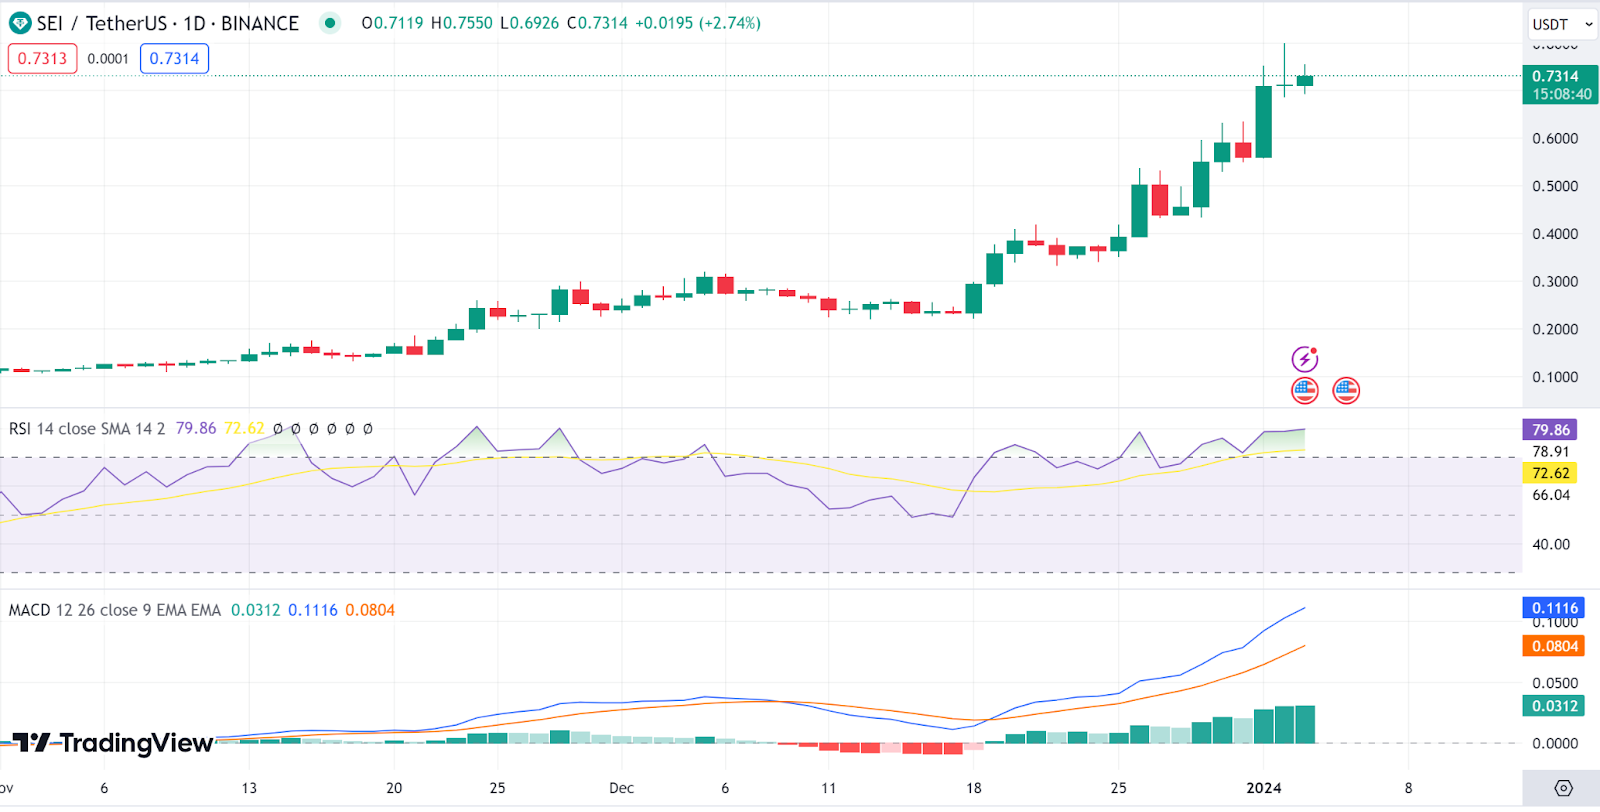
Sei (SEI) is also facing minor corrections as the Sei price stood at $0.728 as of press time, as it sits on a 24-hour jump of 4.5% and a weekly rise of 54%. As a result of the Sei price, the token’s trade volume dropped by 33% during the same period and is presently at $840M.
The Relative Strength Index indicator is, however, headed north as it movies in the overbought region, suggesting bull dominance on the Sei price despite today’s drop. The MACD indicator is also in the green zone, suggesting a bullish short term on the Sei price.
ORDI Price Analysis
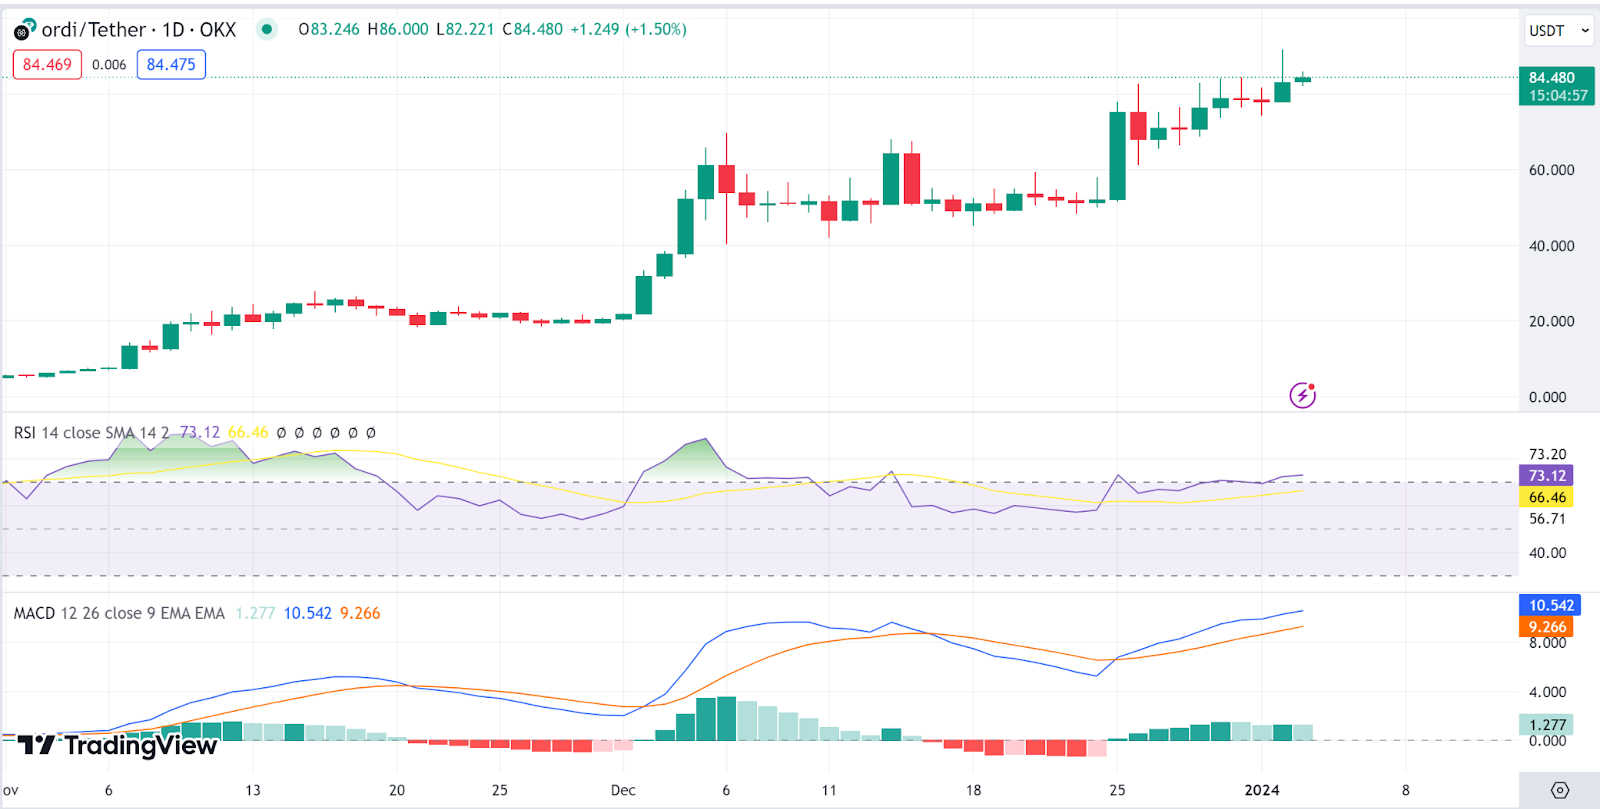
ORDI(ORDI) is another gainer today as the ORDI price stood at $84.3 as of press time, representing an increase of 6.3% in the last 24 hours, while the weekly rise stood at 17.7%. As a result of the ORDI price, the token’s trade volume jumped by 135% during the same period and is presently at $939M.
The Relative Strength Index indicator is headed north as it moves in the overbought region, suggesting bullishness on the ORDI price despite today’s drop. The MACDis, however, reverting towards the red zone, keeping alive the prospect of a correction in the short term despite the bull dominance seen today.
