According to Altcoin Sherpa, an analyst on X, the duo of Arbitrum (ARB) and Optimism (OP) are in pole position to experience exponential growth. Sherpa, in his post, opined that there could be a rotation of profit from other coins into Ethereum (ETH) and tokens linked to the blockchain which includes OP and ARB.
As a result, he told his 202,100 followers to look for entries for ARB and OP around $1.38 and $3.30 respectively.
You dont want to fade this price action.
— Altcoin Sherpa (@AltcoinSherpa) December 22, 2023
Time to do the old rotation to $ETH. Want to buy $ARB or $OP on a dip.
OP entry: $3.30
ARB: $1.38 pic.twitter.com/E1rPHrnW1p
For a while, both tokens failed to make big moves. During that time, some market players opined that the inability to grow was because of ETH’s restriction to trading between $1,800 and $2,100.
However, the last 24 hours have been incredible for OP and ARB. According to CoinMarketCap, ARB’s price was $1.33— a 7.60% jump within the said period. OP’s performance was even better, as the cryptocurrency’s price rose by 20.89%.
Arbitrum (ARB)
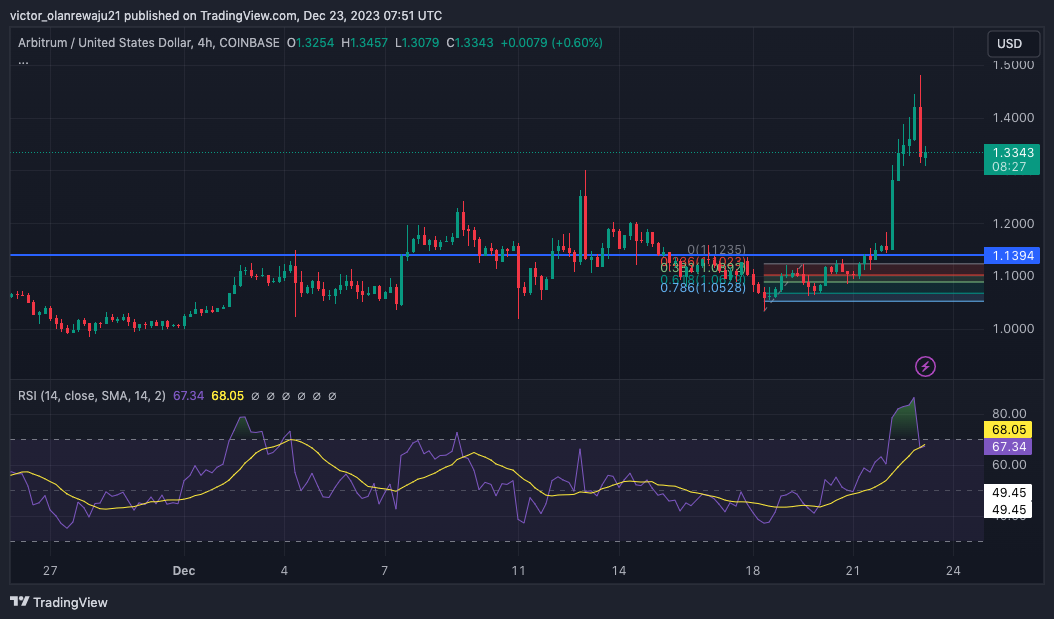
At press time, a sharp sell candle has appeared on the ARB/USD 4-hour chart. This drop implies a significant profit-taking. Another reason was that ARB was overbought as indicated by the Relative Strength Index (RSI) which hit 81.62 on December 22.
Although the RSI reading had dropped to 66.94, ARB’s price may still fall. However, the support at $1.13 seems strong enough to prevent a fall below $1. Also, the Fibonacci retracement gave some insight into possible entry levels.
Should selling pressure increase and breach the $1.13 support, the 0.382 Fib retracement indicated that $1.10 might be a good point to buy ARB. So, traders should watch for this level.

Optimism (OP)
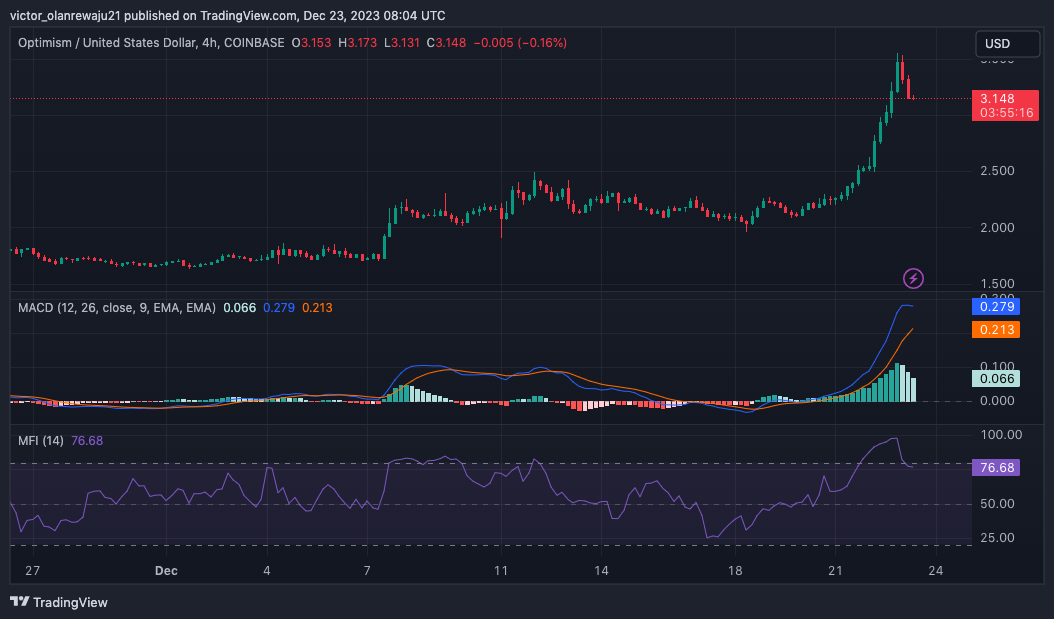
Like ARB, OP’s bullish run has been halted by a rejection. After attempting to jump past the $3.55 region, OP faced resistance which drew the price back to $3.16. However, the Moving Average Convergence Divergence (MACD) showed that there could be room for more upside.
At press time, the MACD was 0.068, and the 12-day EMA had risen above the 26-day EMA, suggesting a bullish momentum for OP. If buying pressure continues to increase, then OP may reclaim $3.55.
Also, a rise in the $4 region may not be invalidated. Meanwhile, the Money Flow Index (MFI) indicated that OP was overbought. This was because the MFI reading initially hit 80 before dropping back to 76.68.

However, a resumption in accumulation could send the price back up. So, entries around $3.13 could be valid for traders.
Disclaimer: The information presented in this article is for informational and educational purposes only. The article does not constitute financial advice or advice of any kind. Coin Edition is not responsible for any losses incurred as a result of the utilization of content, products, or services mentioned. Readers are advised to exercise caution before taking any action related to the company.
 coinedition.com