- 1 The STX coin bulls made a high of $1.31 in March 2023
- 2 The bearish investors have broken major support in 15-minute time frame.
- 3 The Price EMAs have done a bearish crossover, see whether the trend will reverse
STX coin was introduced to the market back in 2019. It serves as a decentralized platform for dApps to use BTC tokens as assets.
Initially, the value of the coin remained in a deep downtrend, but it saw a surge in February 2023. The bulls caused a significant increase in price, from $0.28 to over 300%, within a single month, and the crypto asset reached a new high of $1.31.
However, after achieving its year-to-date high in March of the same year, the value of the coin began to decline. It first broke the support level of $0.79 in April 2023, followed by another significant support level of $0.57 in August. The bears finally defeated the bulls who had been trying to maintain the price above this support level since June.
Present Technical Analysis of STX Coin Price

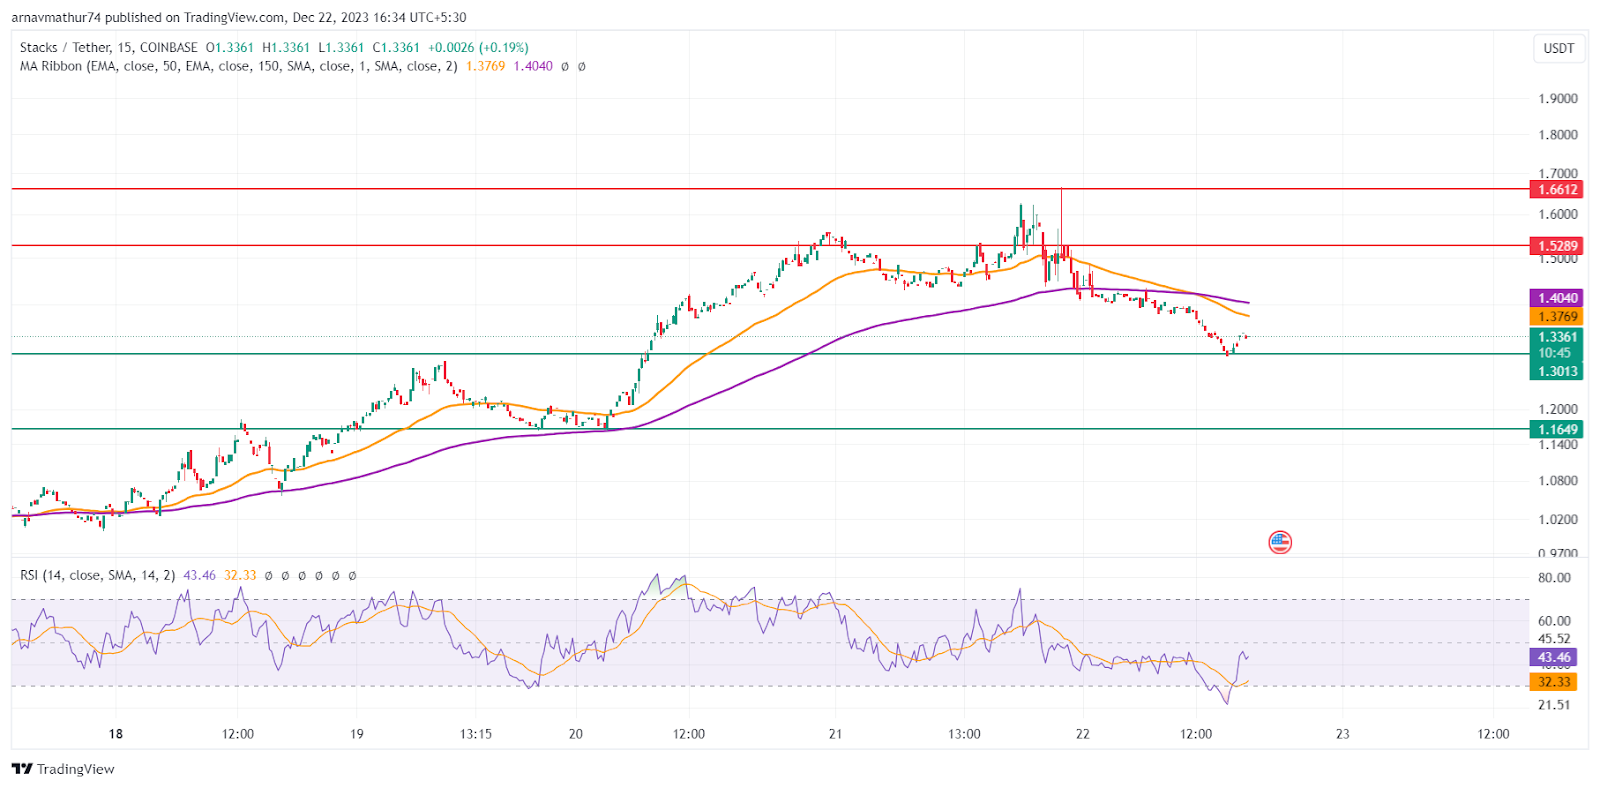
Currently, on the 15-minute time frame, the STX coin price is trading at the level of $1.66 after the Bears broke the immediate support level of $1.43 today. However, the bullish investors haven’t given up; they have taken the support at $1.30, the primary support level.
After the free fall, the 50-minute EMA has done a bearish crossover with the 150-minute EMA. However, this crossover is expected to be short-lived if the bulls can bounce back from the current support.
The second resistance level is at $1.66. After the rejection at the immediate resistance level, the bears created a long wick candle. Therefore, this illiquidity is expected to be filled once before the price rejection.
Price prediction of STX coin
Therefore, the expected move for the STX coin price will be bullish from here. The bulls will likely break the immediate resistance level to fill the liquidity. If the bulls keep the price above $1.52, the trend will reverse, and the EMAs will perform a bullish crossover. Otherwise, the bears will likely push the price below the support level of $1.344.
The RSI, on the other hand, is overcoming the oversold level of 20. It is near the neutral zone of 50 while the Simple moving average line is still at 31. This may trigger a sell-off as the difference between the two is significant

Conclusion
The price of the crypto asset increased significantly from $0.28 to $1.31 within a month but faced resistance and a long wick candle from bears. RSI is moving towards the neutral zone while the Simple moving average line is at 31.
Technical Levels
- Support Levels: $1.30 and $1.16
- Resistance Levels: $1.52 and $1.66
Disclaimer
The views and opinions stated by the author, or any people named in this article, are for informational purposes only. They do not establish financial, investment, or other advice. Investing in or trading in stocks, cryptos or related indexes comes with a risk of financial loss
Steve Anderson is an Australian crypto enthusiast. He is a specialist in management and trading for over 5 years. Steve has worked as a crypto trader, he loves learning about decentralisation, understanding the true potential of the blockchain.
 thecoinrepublic.com
