- 1 STX price shows a continuation of buying momentum and retained the $1 mark.
- 2 Buyers are accumulating persistently and are eyeing the $1.50 mark.
The STX price chart reflects recuperation and has reclaimed the bullish territory above the round mark of $1.00. Furthermore, the buying momentum persistently increased from the last sessions as follow-up buying was witnessed. Per the technicals, investors are showing their interest and are leading the bull rally, setting their sights on the $1.50 mark.
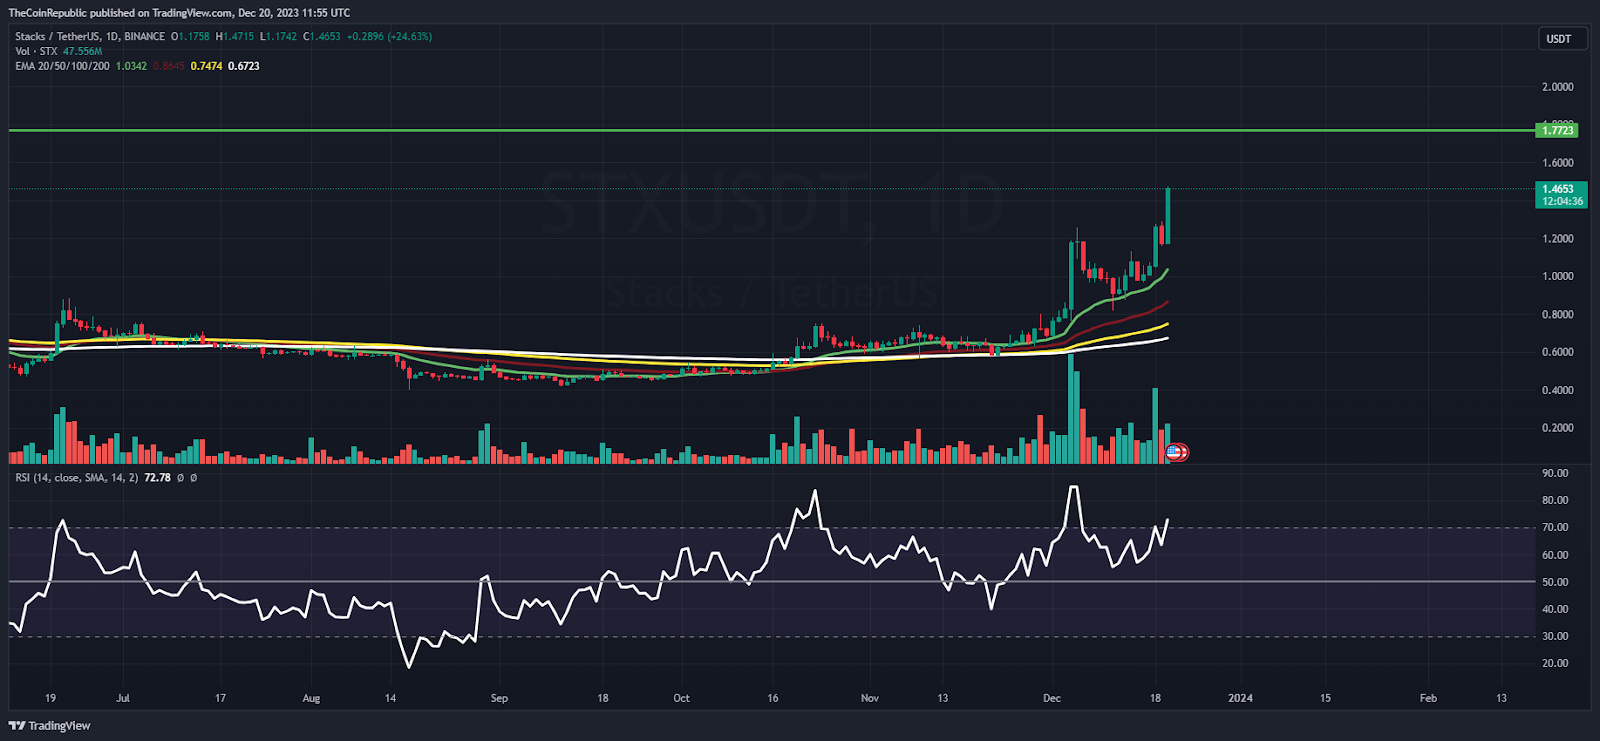
STX price displayed a range breakout and has persisted in extending the buying action above the round mark of $1. Buyers continue to accumulate as follow-on buying action led to a shift in the rally to the immediate hurdle of $1.50. The technicals showcase that STX price has surged over 85% in the past few sessions.
The live price of STX crypto is $1.46, with an intraday gain of 23.67 %, showing bullishness on the chart. Moreover, the trading volume increased by 17.47% to $296.74 Million. However, the pair of STX/BTC is at 0.0000349 BTC, and the market cap is $1.38 Billion. Analysts have maintained a bullish rating, suggesting that the outperformance will continue in the following sessions.
STX on Daily Chart Reflects Bullishness

On the daily chart, STX price revealed a massive bounce as buying momentum was noted in recent sessions. Moreover, the higher highs formation and the bullish engulfing candlestick were witnessed, and sellers were trapped in the past sessions. Per the Fibonacci retracement levels, STX price escaped the 61.8% Fib zone and has climbed above the upper bollinger band.
The Relative strength index (RSI) curve is in the bullish zone above the midline reflecting buying momentum on the chart. Furthermore, the MACD indicator showed a bullish crossover and green bars on the histogram, suggesting that outperformance will continue for the following sessions.
Weekly Chart Shows Bullish Crossover

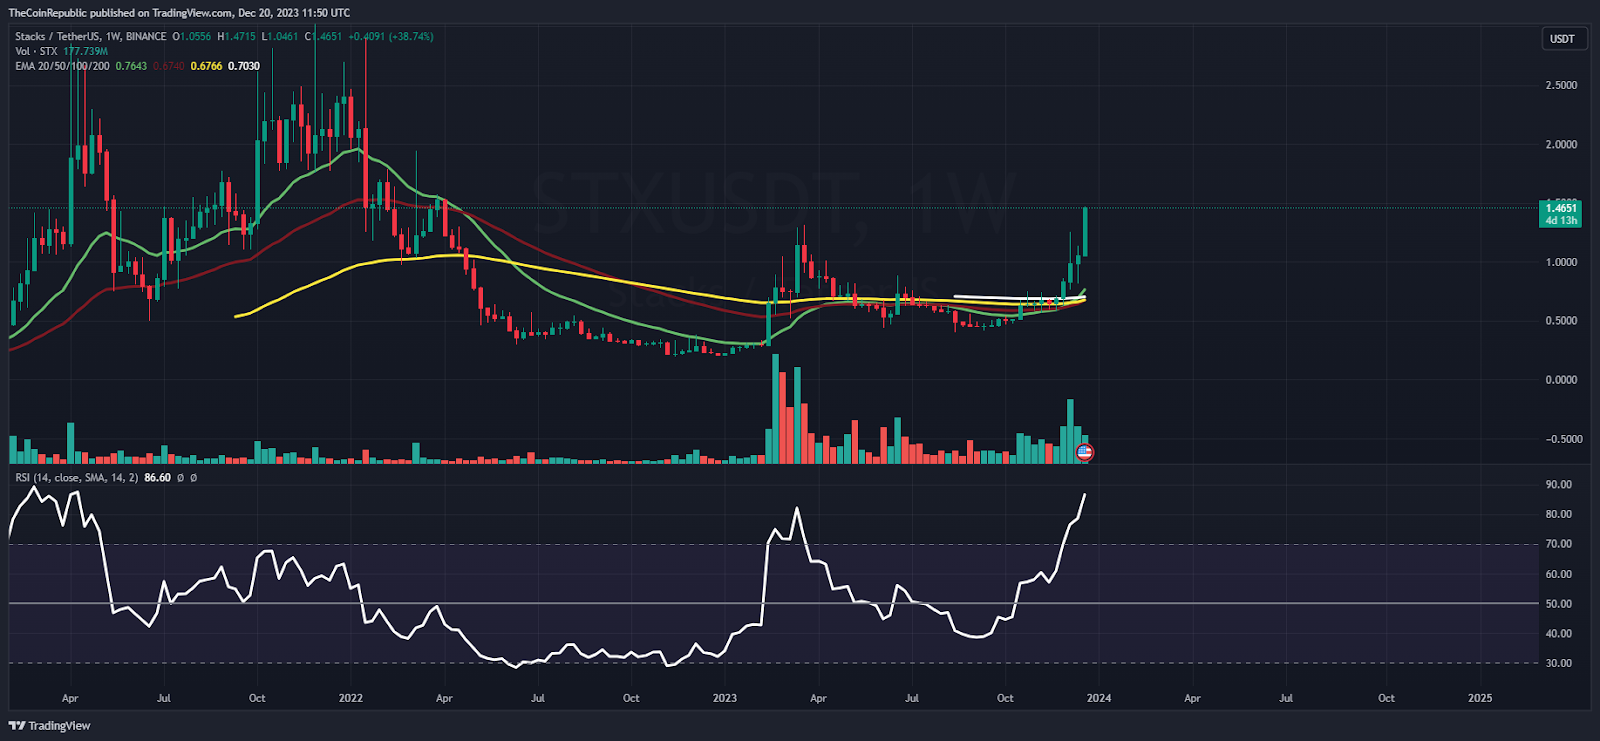
On the weekly chart, STX price displayed a golden crossover and surpassed the 200-day EMA, reflecting bullish momentum in recent sessions. Furthermore, the price action indicates the buying action, as STX crypto is ready to reach the immediate hurdle of $1.50. The $2.00 is likely to be captured soon.
Summary
STX price displays a follow-on buying action and has persisted in delivering bullishness on the charts. Moreover, the price action reveals the bullish momentum, and the STX price has reached the blue sky zone. Further short-covering rally will extend the rally to the round mark of $2 in the following sessions.
Technical Levels
Support Levels: $1.30 and $1
Resistance Levels: $1.50 and $2
Disclaimer
The views and opinions stated by the author or any other person named in this article are for informational purposes only and do not constitute financial, investment, or other advice. Investing in or trading crypto or stocks comes with a risk of financial loss.
Steve Anderson is an Australian crypto enthusiast. He is a specialist in management and trading for over 5 years. Steve has worked as a crypto trader, he loves learning about decentralisation, understanding the true potential of the blockchain.
 thecoinrepublic.com