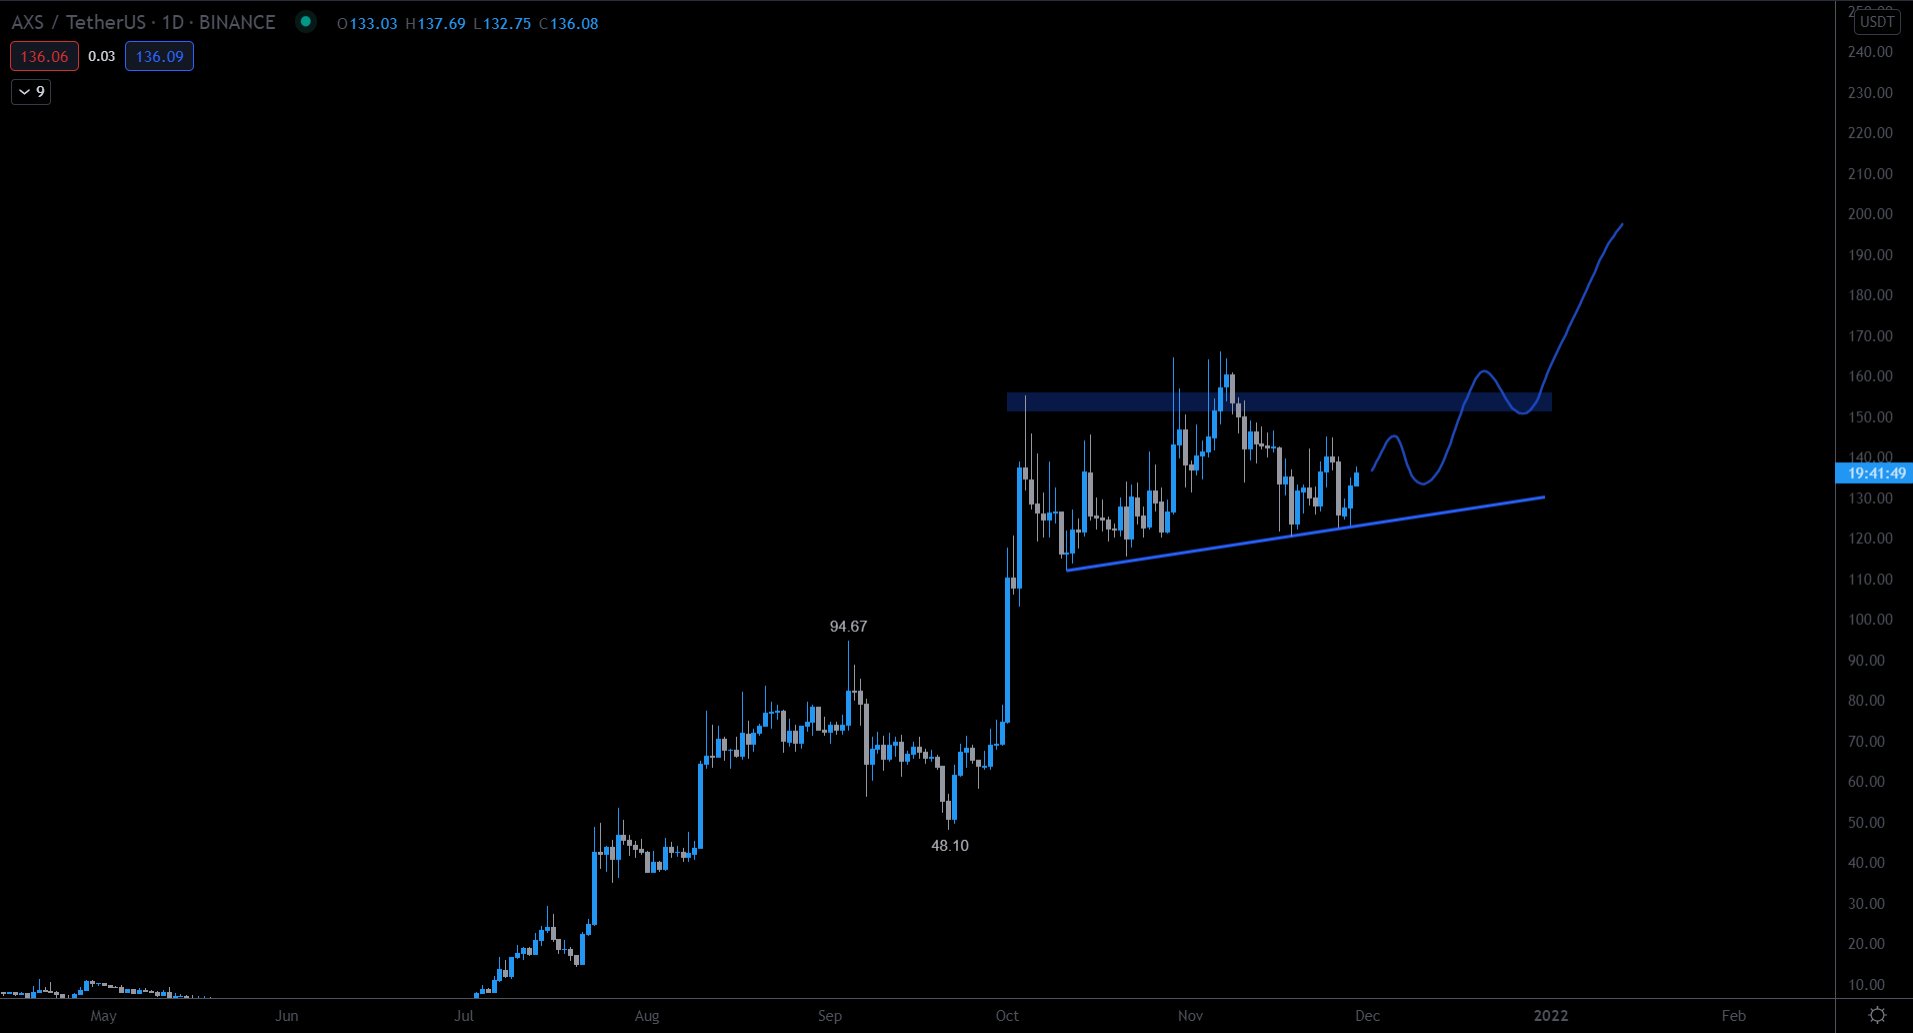
Axie Infinity (AXS) might have reached the end of its consolidation pattern. This would be confirmed by a breakout from the current pattern.
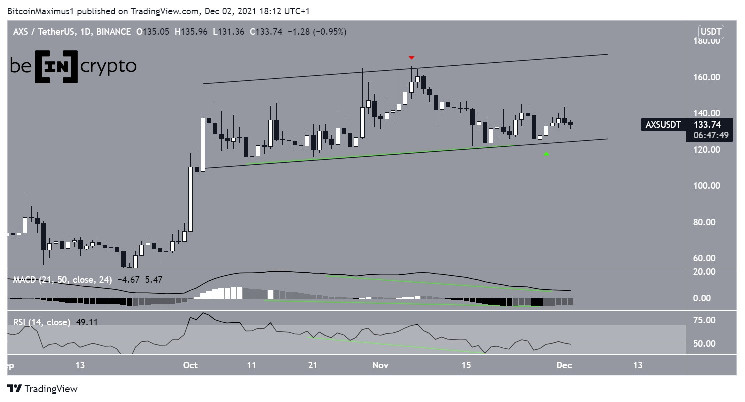
Since Oct 18, AXS has been trading inside a range between $110 and $160. It seems that this movement is contained inside an ascending parallel channel. On Nov 6, the token was rejected by the resistance line of the channel (red icon) and has been decreasing since.
More recently, the token bounced at the support line of this channel on Nov 28 (green icon). As long as it does not break down from it, the bullish structure remains intact.
Technical indicators are bullish, supporting the possibility that AXS will eventually break out from the channel.
This is especially visible growing hidden bullish divergence developing in both the RSI and MACD. This is an occurrence that often transpires at the end of a consolidation pattern and leads to trend continuation. Therefore, since the preceding trend is upwards, a breakout would be the most likely scenario.
Short-term AXS movement
Cryptocurrency trader @TradingTank outlined an AXS chart, stating that the token is likely to break out and move towards a new all-time high price.
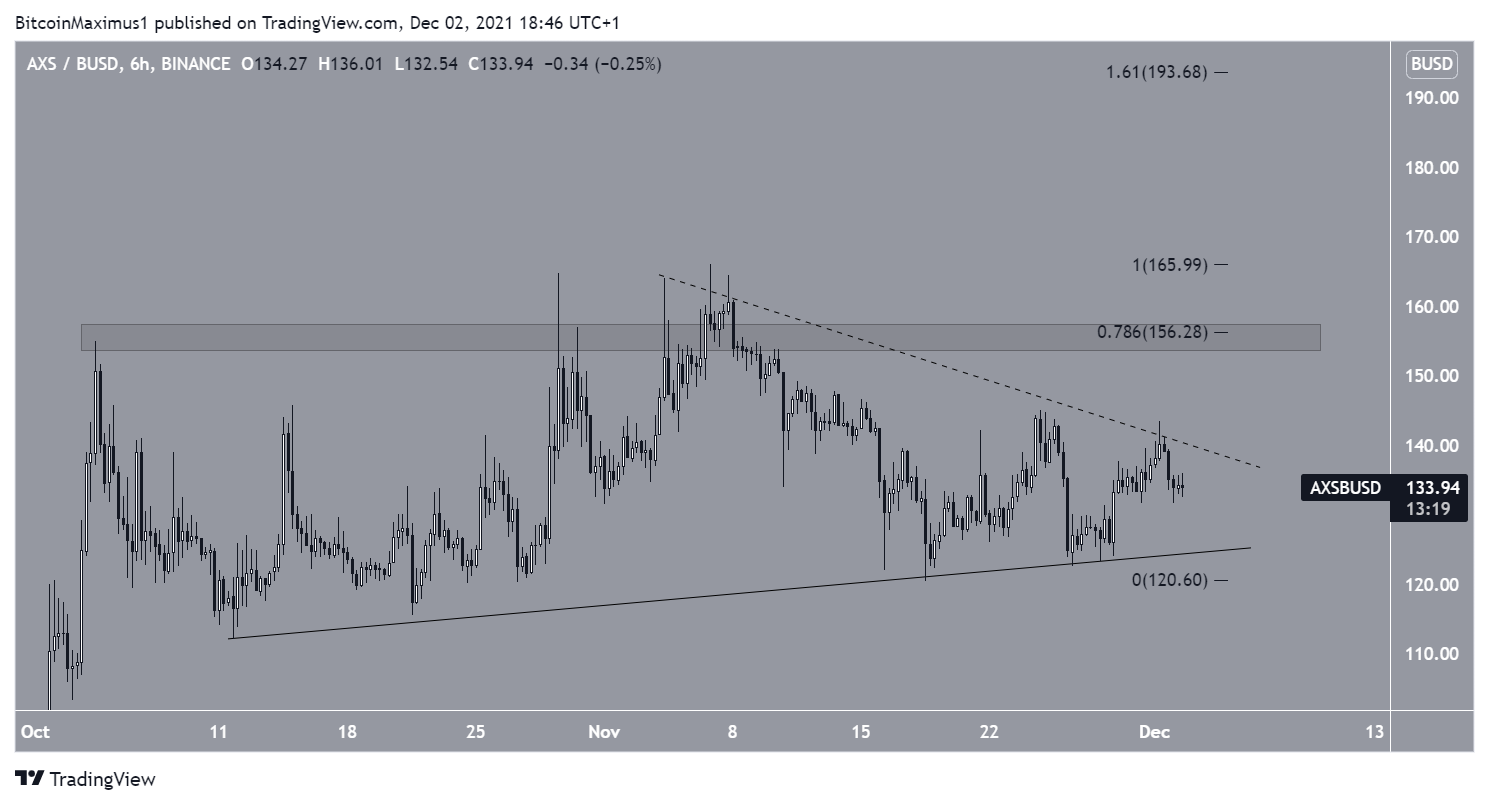
The shorter-term six-hour chart readings align with those from the daily time-frame. If the wick movements of Nov 8 are discounted, it looks like AXS is trading inside an ascending triangle, which is considered a bullish pattern.
In this case, the resistance area would be at $156, both a horizontal resistance level and the 0.786 Fib retracement level.
Once the token manages to break out from the short-term descending resistance line, the rate of increase is expected to accelerate.
If a breakout occurs, the next closest resistance area would be at $194. This is the 1.61 external Fib retracement resistance level when measuring the entire drop.