Today, the Injective (INJ) price increase led to a new all-time high of $34.64 on December 15.
The INJ price has created several long upper wicks since the high. Is this a sign of an impending decrease, or will INJ push to a new all-time high?
Injective Holds Above $30
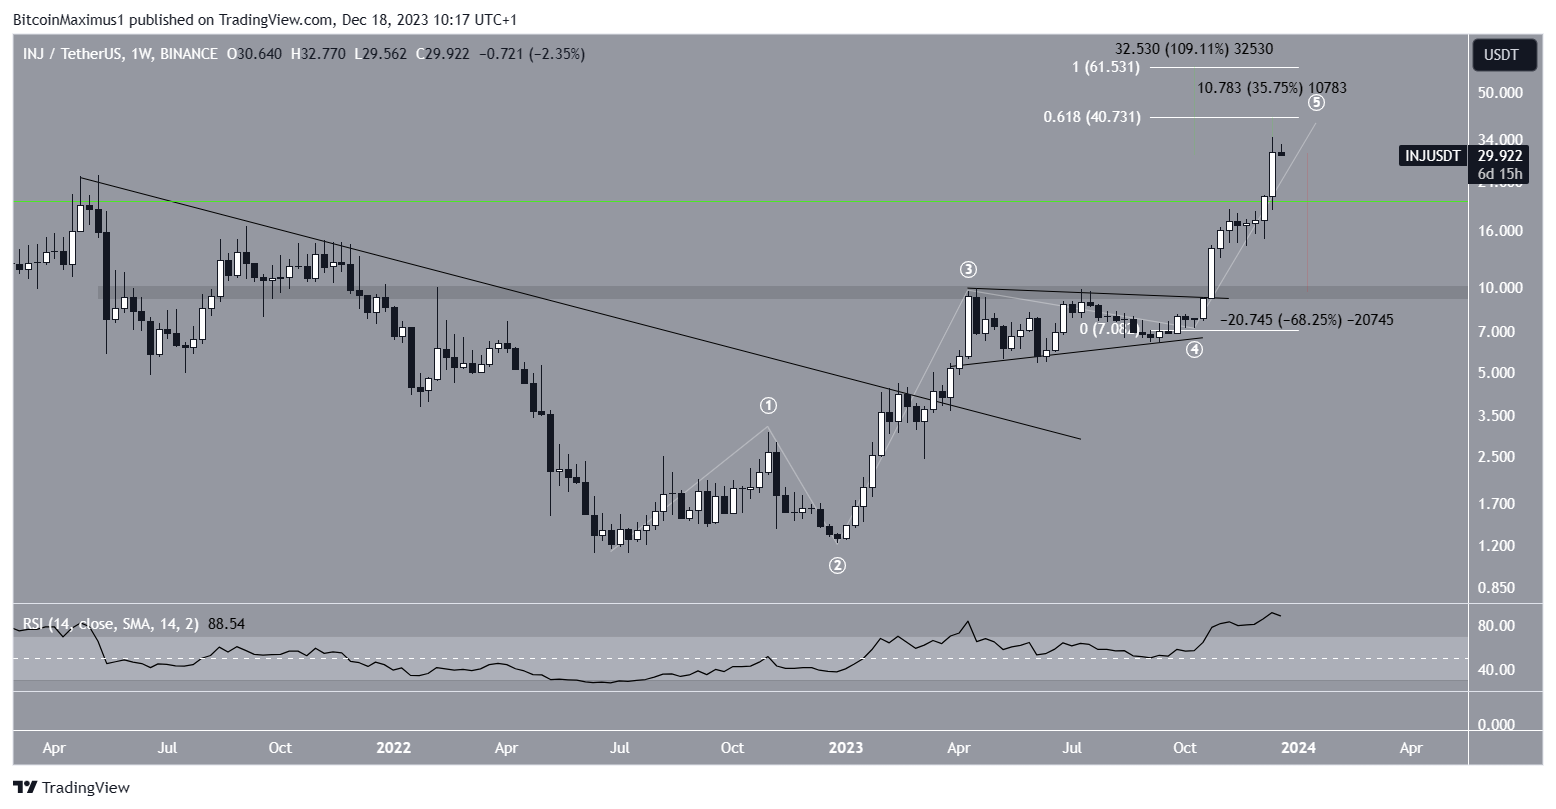
The technical analysis from the weekly time frame shows that the INJ price has increased quickly since the start of the year. The INJ price increase culminated with a new all-time high of $34.60 last week, an upward movement of nearly 2,700% in 2023.
During the upward movement, the altcoin first cleared a diagonal resistance in place since the previous all-time high. Then it moved above a critical horizontal resistance, accelerating the rate of increase.
Since the second breakout, the INJ price has created eight bullish weekly candlesticks in nine weeks.

With the RSI as a momentum indicator, traders can determine whether a market is overbought or oversold and decide whether to accumulate or sell an asset.
Bulls have an advantage if the RSI reading is above 50 and the trend is upward, but if the reading is below 50, the opposite is true.
The weekly RSI is increasing and is above 50. Even though it is in overbought territory, it has not generated any bearish divergence.
What Are Analysts Saying?
Cryptocurrency traders and analysts on X are bullish on the future INJ price trend.
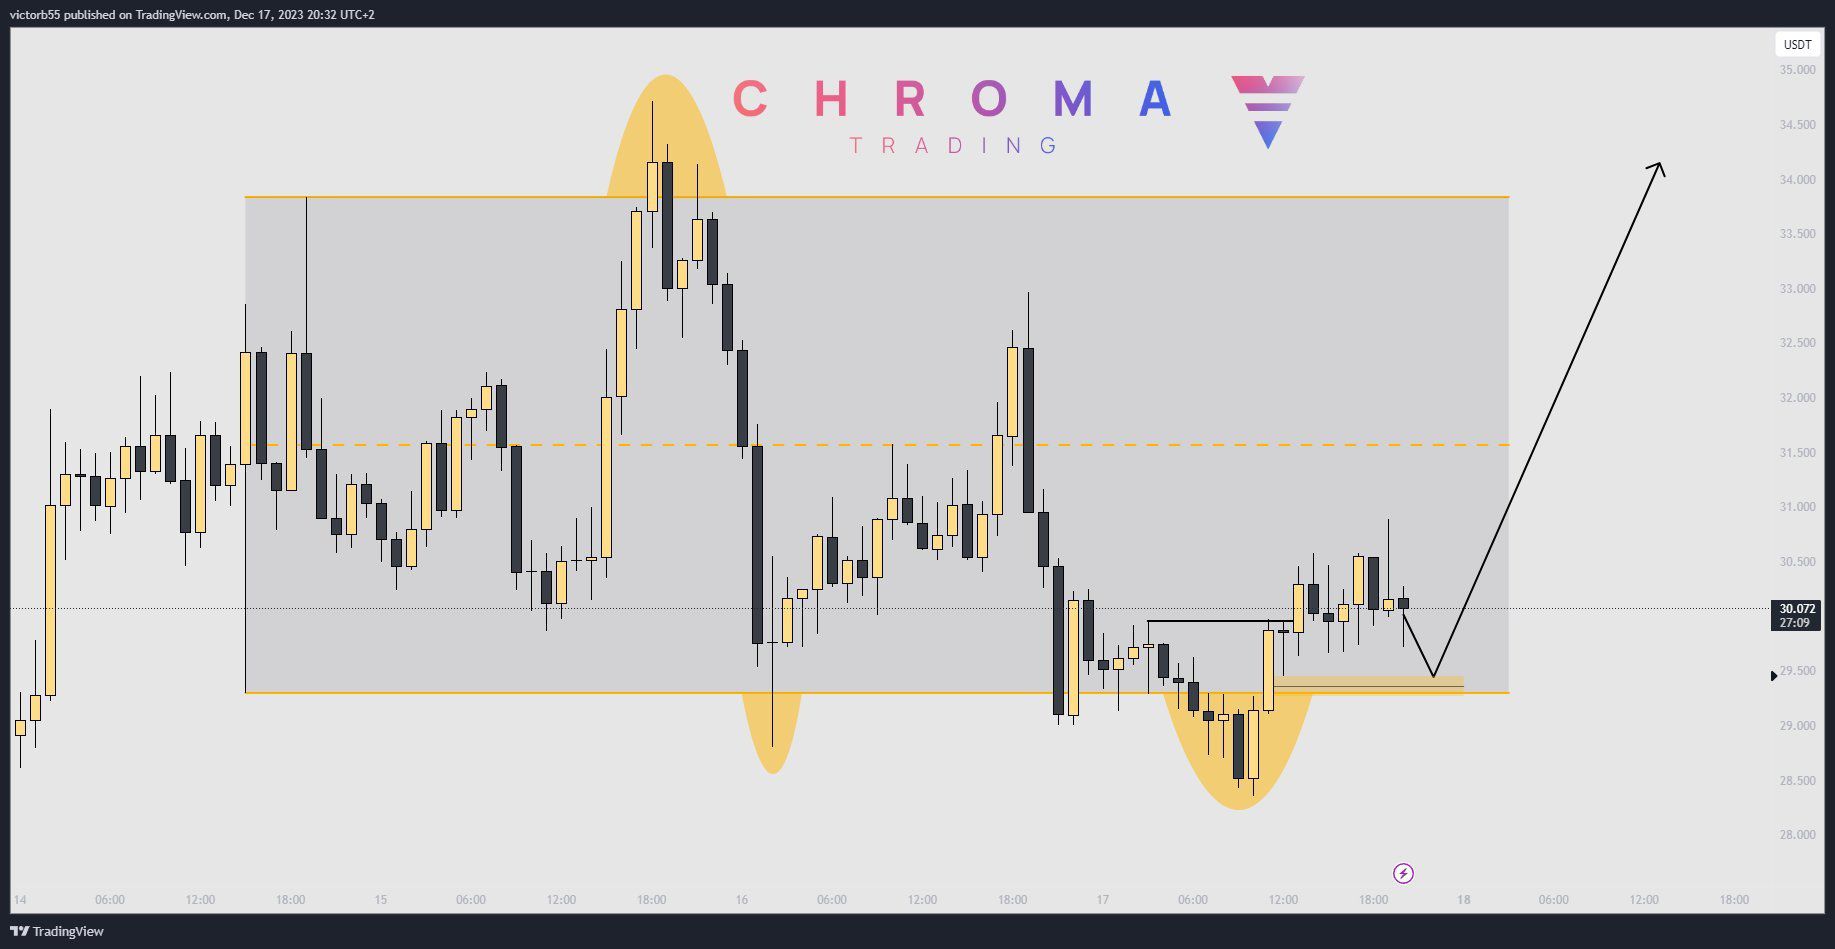
Victorious is bullish because of a short-term Wyckoff Accumulation pattern.

OurCryptoTalk is bullish for fundamental reasons. The account tweeted its three main causes of the ongoing upward movement.
Surge in Perpetual Futures Trading: Injective Protocol’s significant price increase is propelled by a massive surge in Perpetual Futures trading, surpassing $25.5 billion in the last 24 hours. This surge, driven by leverage, is contributing to heightened price volatility.
Exchange Incentives for Volatility: Centralized exchanges, particularly the Weex Exchange, are incentivized to generate volatility through Perpetual Futures trading, leading to substantial profits. The observed similarities in design between the Weex Exchange and Binance raise suspicions of potential market manipulation.
Leverage-Fueled Acceleration: The current price rally is not a result of natural spot market activity but is driven by leverage, especially in Perpetual Futures. Short-term traders seeking gains through leverage are accelerating the rally, posing increased risk and volatility for both short-term and long-term investors.
Rekt Capital is also bullish since INJ is in price discovery. He noted the previous all-time high as the support level that has to hold for this trend.
INJ Price Prediction: Is a Local Top Close?
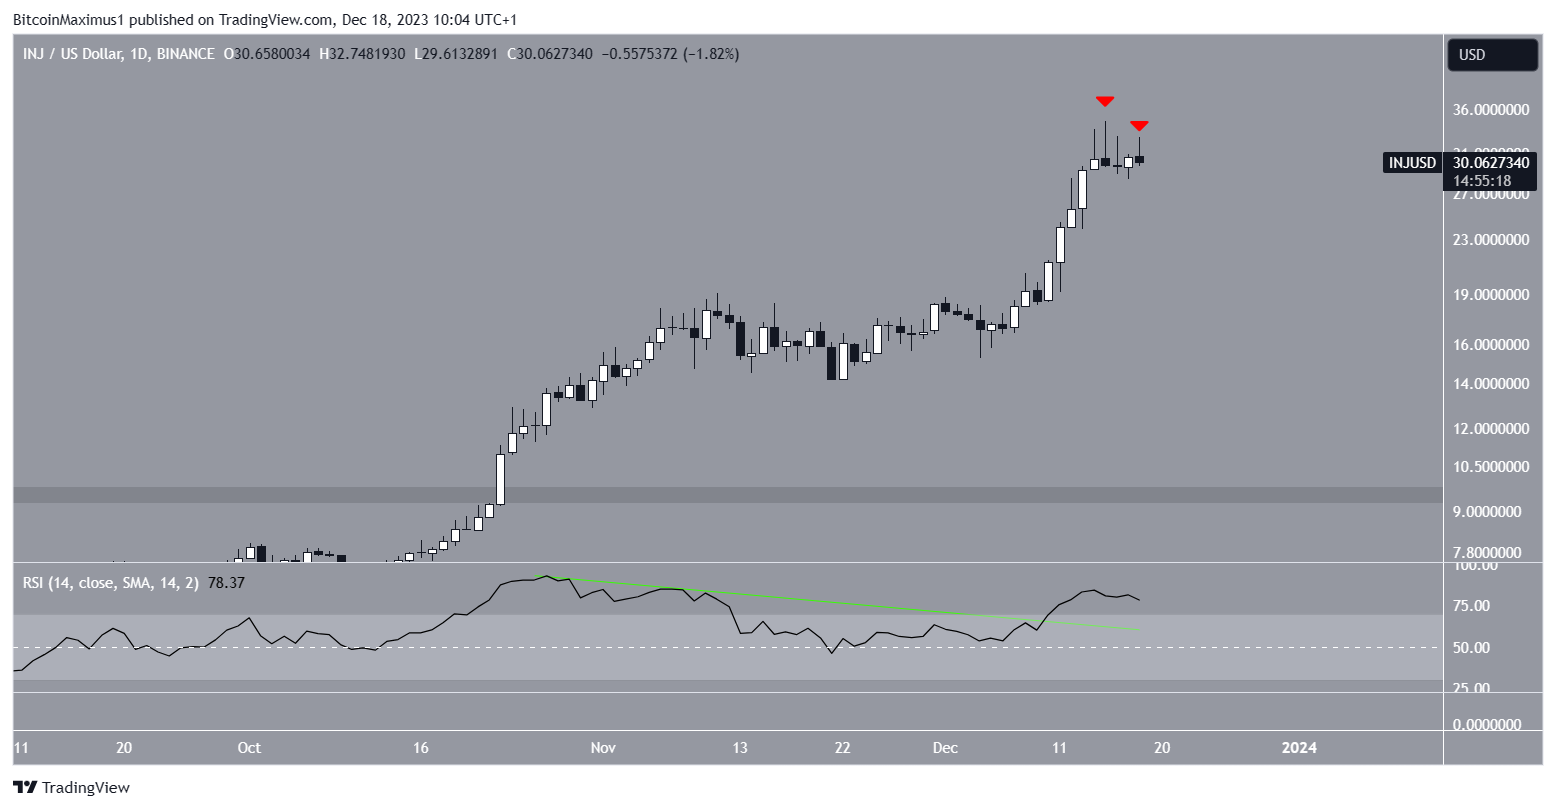
The daily time frame analysis gives a mixed outlook. On the bearish side, the INJ price has created several long upper wicks (red icons) since the high. These are considered signs of selling pressure.
However, the daily RSI has broken out from a bearish divergence trend line (green), indicating that the trend is still bullish. So, even though the time frame shows the potential for a short-term retracement, the long-term trend seems bullish.

Technical analysts utilize the Elliott Wave theory to identify recurring long-term price patterns and investor sentiment, assisting them in ascertaining the direction of the trend. According to the main wave count, the INJ price is in the fifth wave of this increase, after which a significant correction will ensue.
The projected target for the culmination of this movement is $40. This target is determined by applying 0.618 times the combined length of waves one and three to wave five, representing a 35% increase from the current price.
As there is no bearish divergence observed in the weekly RSI, wave five could extend further and potentially reach the subsequent target at $60. The INJ price will have to increase by 110% to reach this target.
However, once the INJ price hits the $40 level, the outcome will be crucial in determining whether wave five will continue to extend.

Despite the bullish outlook for the INJ price, a close below the $20 support region (green) would signal the conclusion of the upward movement. In such a scenario, there is a high likelihood of a 70% decline to the nearest support area at $9.80.
For BeInCrypto’s latest crypto market analysis, click here.
 beincrypto.com
