Bitcoin Analysis
Bitcoin’s price started the new week on a positive note and closed Monday’s daily candle +$520.
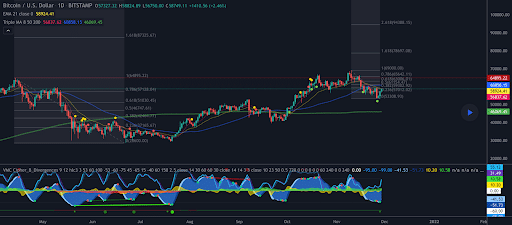
The BTC/USD 1D chart below from BGMind_Control shows the importance of the .238 [$57,012.02] and BTC bulls holding that level as support again.
Overhead targets for bullish bitcoin traders are 0.38 [$59,302.92], 0.5 [$61,154.47], .618 [$63,006.01], 1 [$69,000], 1.618 [$78,697.08] and the 2.618 [$94,388.15].
The target for bearish BTC traders if they can breach the 0.236 [$57,012.02] is 0 [$53,308.93].

BTC’s 24 hour price range is $56,227-$58,929 and its 7 day price range is $53,827-$59,206. Bitcoin’s 52 week price range is $17,764-$69,044.
The price of bitcoin on this date last year was $18,169.
The average price of BTC for the last 30 days is $60,936.
Bitcoin [+0.91%] closed its daily candle worth $57,845 and in green figures for the fourth day out of the last five days.
Ethereum analysis
Ether outperformed BTC on Monday and closed its daily candle +$145.3.
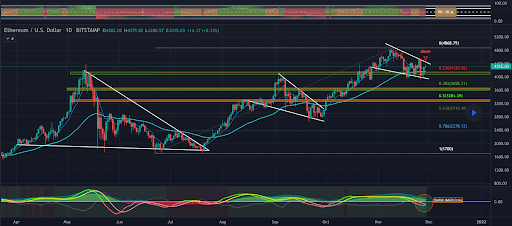
The ETH/USD 1D chart below from Mohammed_Khan illuminates the strength of the 0.236 [$4,120.96] as support for Ether bulls.
The most important level for Ether bulls to get back to now is 0 [$4,868.79]. If bulls can eclipse that level and break ETH’s all-time high then price discovery will be enacted.
For bears, their route to success is finally testing and cracking the 0.236 and getting a candle close below that level on a significant time frame. Below that level, bears are targeting the 0.382 [$3,658.31], 0.5 [$3,284.39] and the 0.618 [$2,910.48].

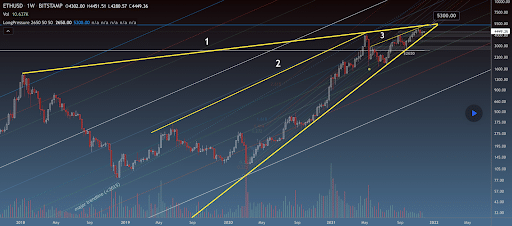
Ether’s weekly chart shows a rising wedge inside a larger rising wedge. Traders can see this on the ETH/USD 1W chart below from reees.

ETH’s 24 hour price range is $4,237-$4,489 and its 7 day price range is $4,021-$4,525. Ether’s 52 week price range is $541.28-$4,878.
The price of ETH on this date in 2020 was $612.26.
The average price of ETH for the last 30 days is $4,426.
Ether [+3.38%] closed its daily candle on Monday worth $4,442.82. ETH’s price has closed the daily timescale in green figures for four of the last five days.
Polygon Analysis
Polygon’s price is up more than 12% over the last 48 hours, at the time of writing and finished Monday’s daily candle +$.16.
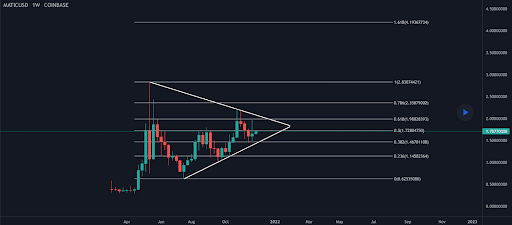
The MATIC/USD 1W chart below from LA_Designer shows the important levels for MATIC traders.
MATIC’s price is currently trading inside a giant triangle pattern which bullish traders can breach at the 0.618 [$1.98]. Above that level the overhead resistance for bulls is at the 0.786 [$2.35], 1 [$2.83] and the 1.618 [$4.19].

Bearish traders participating in the MATIC market will hope to break out of the triangle pattern to the downside at the 0.382 [$1.46]. Targets beneath that level are the 0.236 [$1.14] and 0 [$.625].
MATIC’s 24 hour price range is $1.63-$1.79 and its 7 day price range is $1.53-$1.94. Polygon’s 52 week price range is $.014-$2.62.
MATIC’s price on this date last year was $.018.
The average price for MATIC over the last 30 days is $1.76.
Polygon [+9.99%] closed its first daily candle of the new week worth $1.81 and in green digits for the second consecutive day.
 en.cryptonomist.ch