- 1 Apecoin price noted a rising parallel channel on the chart.
- 2 Buyers continue to accumulate and are willing to surpass the 200 day EMA.
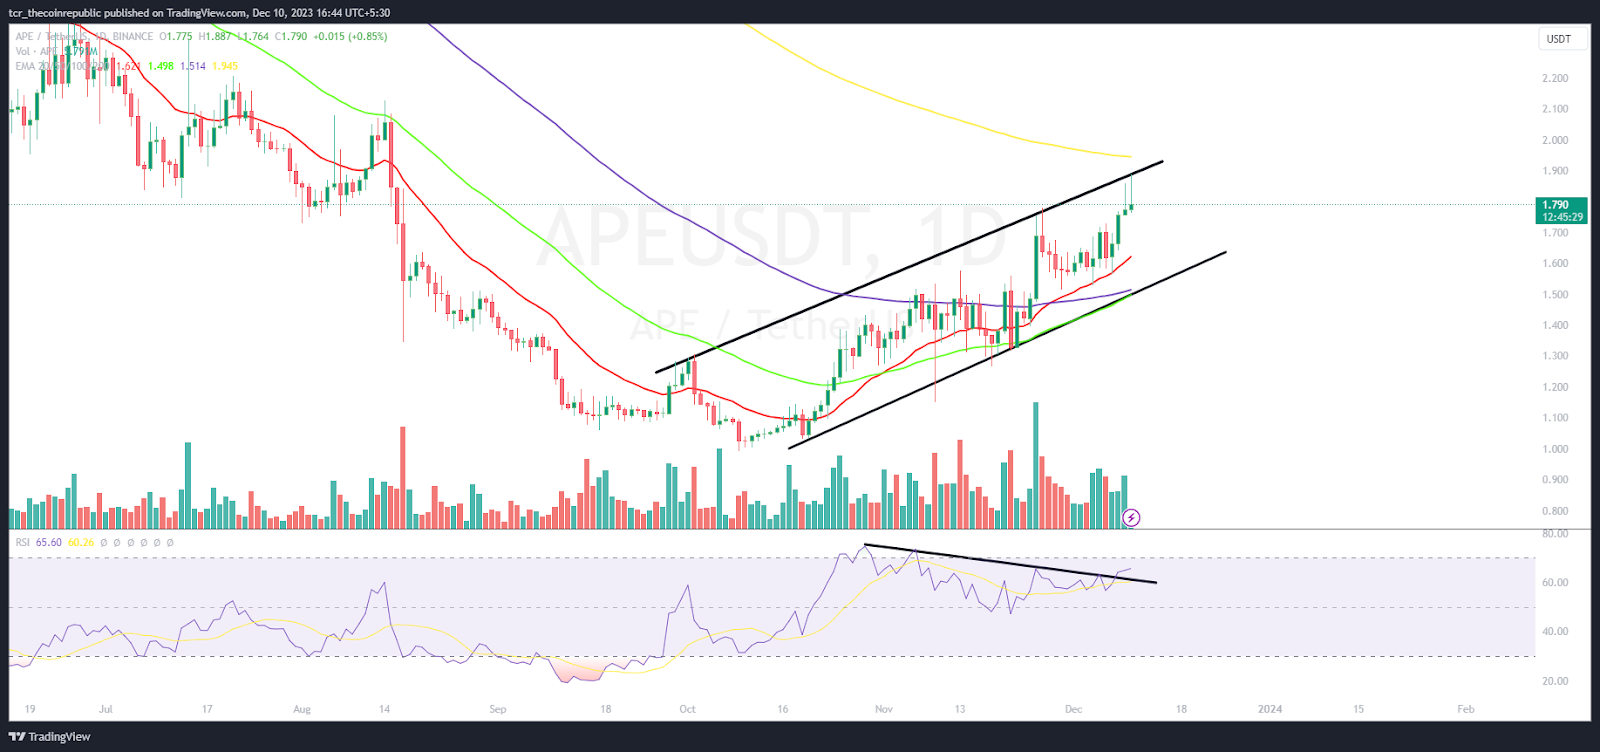
APE price recovered from the round mark of $1.00 and witnessed a recovery inside the rising parallel channel in recent sessions. ApeCoin (APE) is a cryptocurrency inspired by renowned NFT collectibles – the Boat Ape Yacht Club, the biggest NFT project by market capitalization. APE price is heading for the round mark of $2.00 but formed an inverted hammer candlestick near the channel’s upper trendline, signaling a rejection.
APE price healed slowly & steadily and surged over 60%, highlighting investors’ interest in the recent sessions. The technicals highlight the bulls’ dominance, as the buyers persisted in adding long positions. However, the Apecoin price is trading near the 200-day EMA, where sellers have maintained their grip and are prepared for battle. Per the Fibonacci retracement zone, APE price is sustaining the gains above the 50% fib zone and is reflecting the bullish momentum on the chart.
The live price of Apecoin is $1.83, with an intraday drop of 1.79%, highlighting neutrality on the chart. Moreover, the trading volume increased by 16.66% to $111.65 Million. However, the pair of APE/BTC is at 0.0000409 BTC, and the market cap is $234.92 Million. Analysts have maintained a neutral rating and suggest a volatile outlook for the upcoming sessions.
APE Price Forms Rising Parallel Channel on Daily Chart

On the daily chart, APE price formed the higher highs pattern and persisted in surging amid the crypto market pump. However, the ongoing price action highlights the rejection from the upper trendline, as buyers failed to sustain on the higher zone. Furthermore, the sellers are adding short positions, so a sudden sell-off will not be surprising.
The RSI curve stayed near 65, delivering a negative divergence, suggesting that the APE price may face retracement and will drop gains in the following sessions. However, the MACD indicator shows a bullish crossover, which means that APE price chart may show profit booking, and buyers are challenged to surpass the 200-day EMA.
Weekly Charts Noted Rebound From 52-Week Low

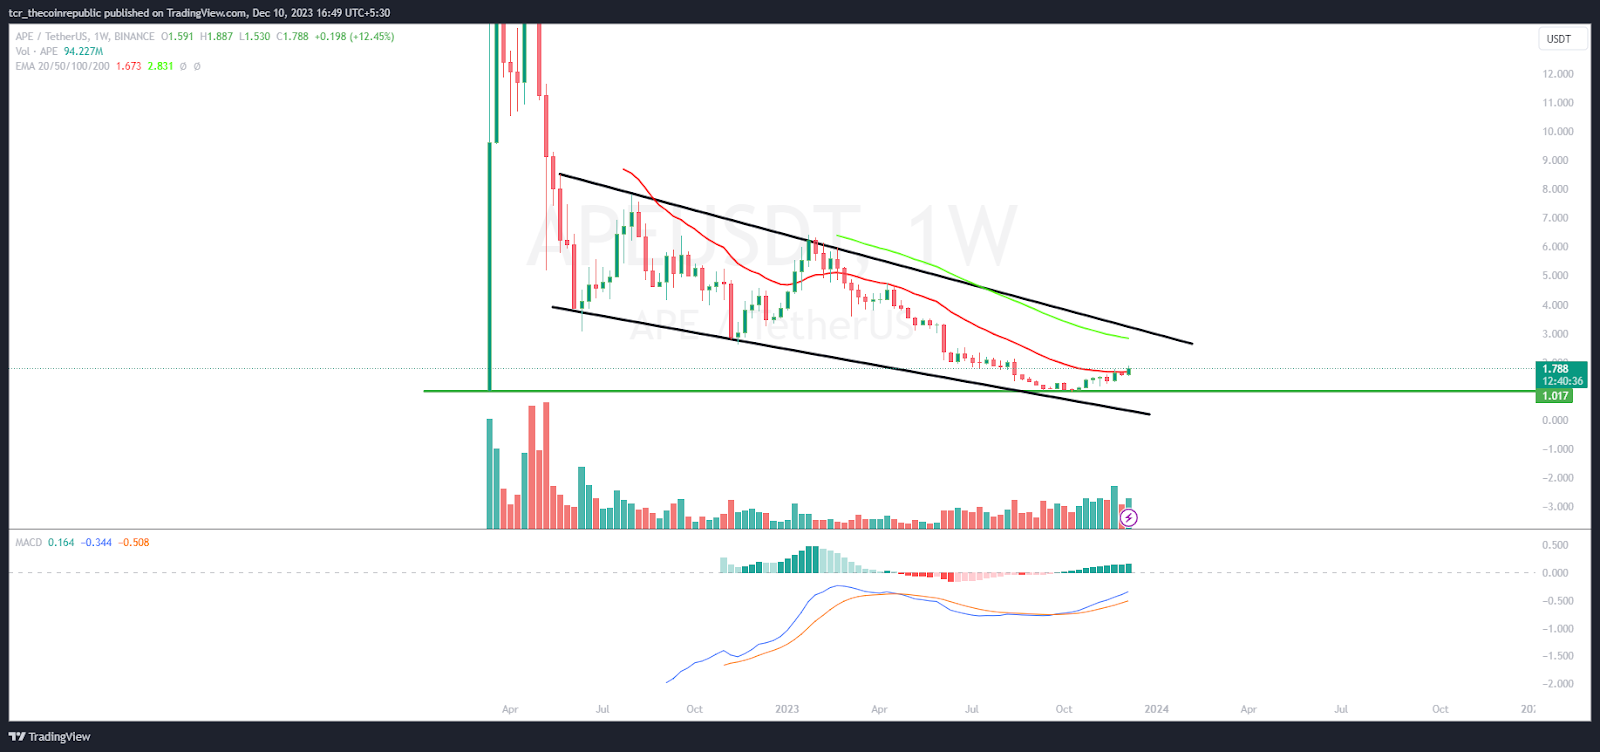
On the weekly chart, APE price glimpses a rebound from its (ATL) All-Time Low of $1.00, noted on Mar 17, 2022, which was recently retested. Afterward, buyers regained their strength and led a smart recovery in the past few sessions.
Summary
APE price noted a surge inside the rising parallel channel, surpassing the critical hurdle of $1.50, getting closer to the foremost hurdle of $2.00. However, the 200-day EMA is the burden, which creates a strong challenge for the bulls to escape, as profit booking was noted in the recent sessions.
Technical Levels
Support Levels: $1.60 and $1.30
Resistance Levels: $2.00 and $2.20
Disclaimer
The views and opinions stated by the author or any other person named in this article are for informational purposes only and do not constitute financial, investment, or other advice. Investing in or trading crypto or stocks comes with a risk of financial loss.
Steefan George is a crypto and blockchain enthusiast, with a remarkable grasp on market and technology. Having a graduate degree in computer science and an MBA in BFSI, he is an excellent technology writer at The Coin Republic. He is passionate about getting a billion of the human population onto Web3. His principle is to write like “explaining to a 6-year old”, so that a layman can learn the potential of, and get benefitted from this revolutionary technology.
 thecoinrepublic.com
