- 1 The EGLD price chart noted a sharp spike above the critical hurdle of $50.
- 2 Buyers are gaining traction and have persisted in extending the gains.
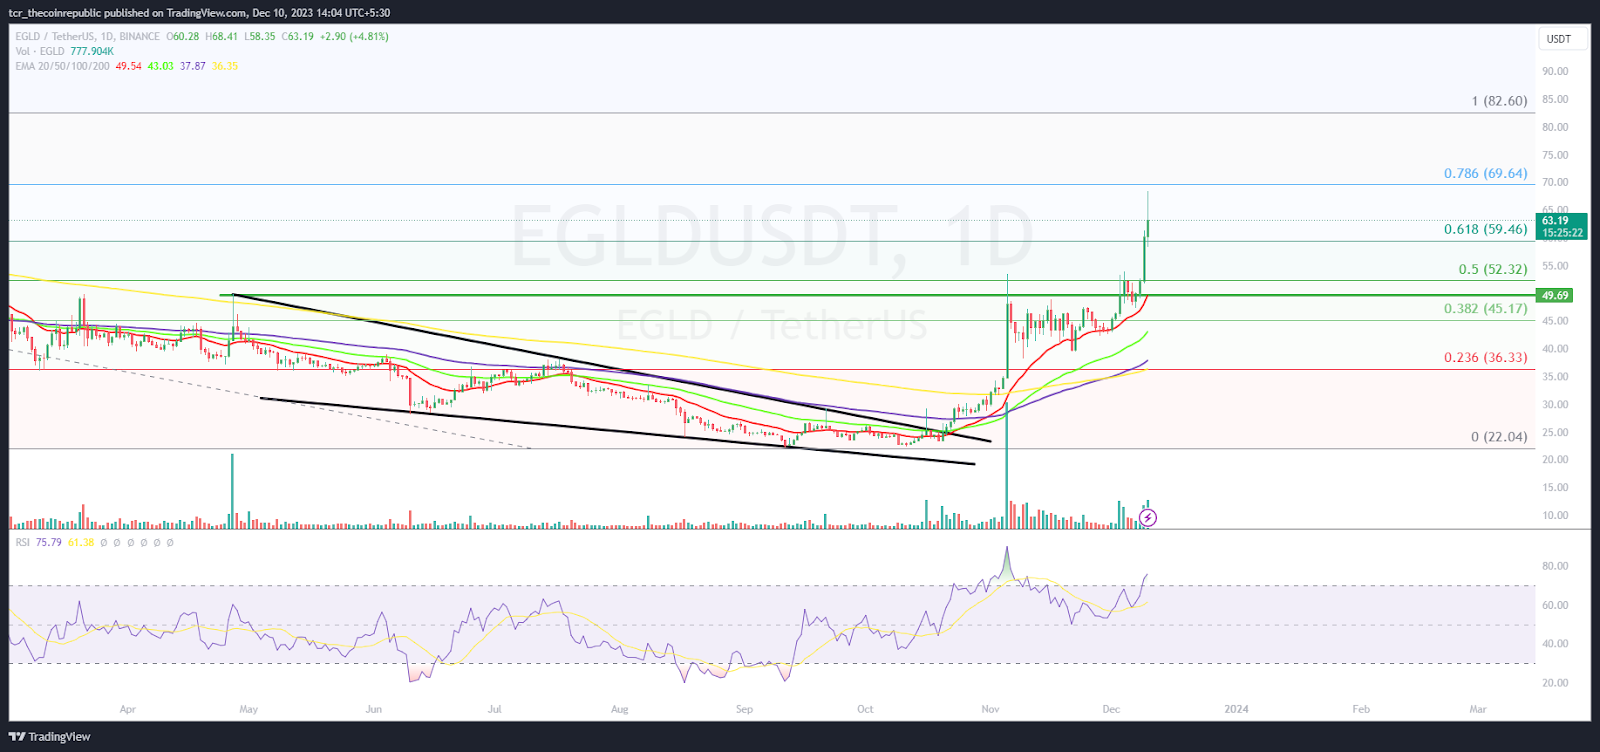
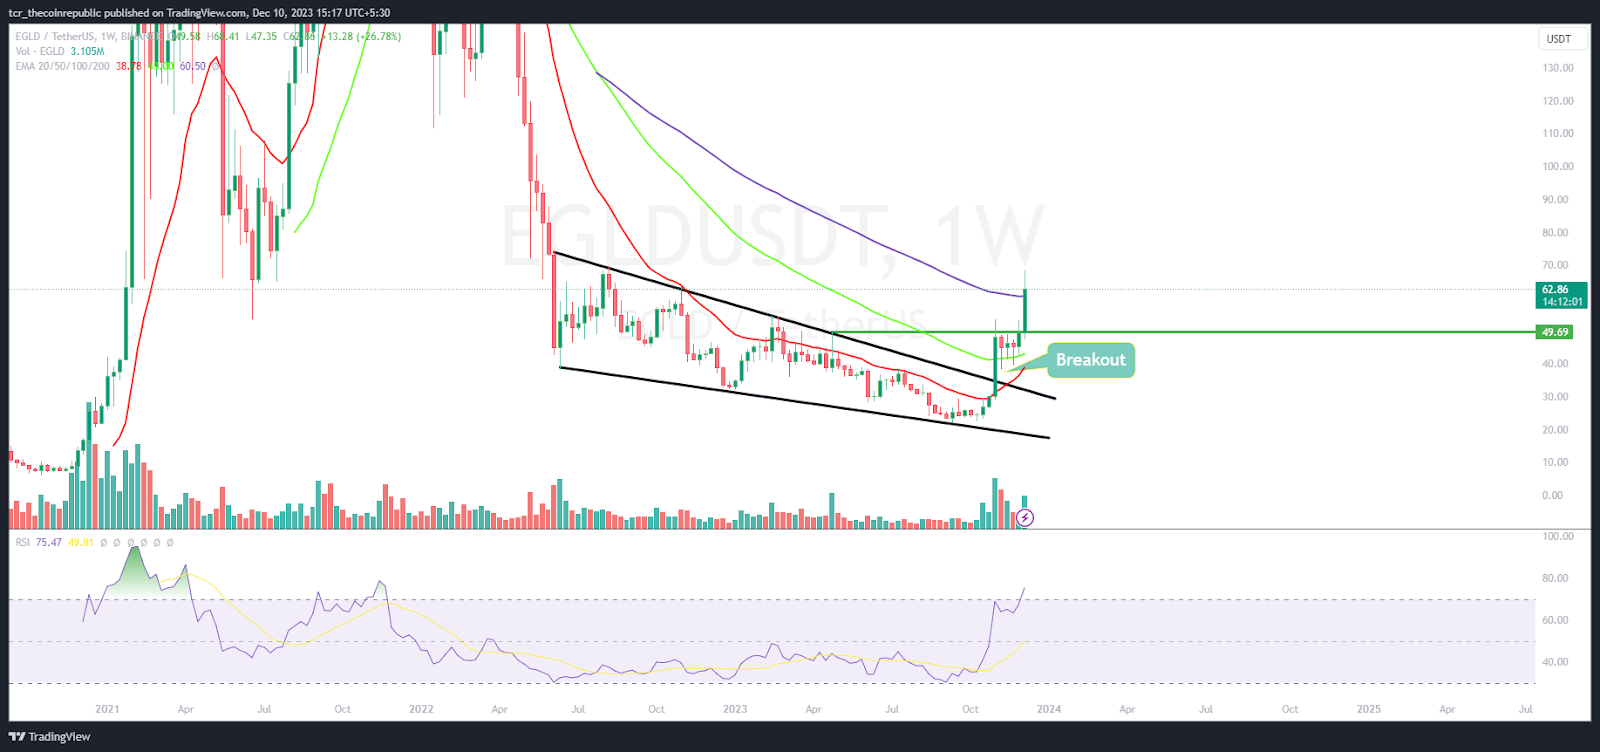
EGLD price darted in a bullish move, topped the crucial hurdle of $50, and persisted in furnishing the follow-on buying action. EGLD crypto broke out of the falling wedge pattern and in a trend reversal. A golden crossover was noted in this bullish spike, higher high sequences were seen over the recent sessions. The technicals showcased the bulls’ dominance, and buyers are celebrating the rally ahead of the Santa rally in the crypto market.
EGLD price snappily shifted above $50, going up by 55% recently, highlighting strong investor interest. Per the Fibonacci retracement levels, the EGLD price has transcended the 61.8% zone but faced rejection from the 78.6% zone. The price action clearly exhibits bullish momentum and implies that the EGLD price may reach $100 soon.
The live price of EGLD crypto is $62.80, with an intraday gain of 16.04%, showing massive buying momentum on the chart. Moreover, the trading volume increased by 16.72% to $399.73 Million. However, the pair of EGLD/BTC is at 0.00147 BTC, and the market cap is $1.70 Billion. Analysts have maintained a technical buy rating and suggest an impressive outlook for the upcoming sessions.
EGLD Price Spiked Above $50 Daily Charts Displays Breakout
 EGLD Price Prediction: EGLD Price Reached Blue Sky Zone Above $50">
On the daily chart, the EGLD price shows a sharp rehab from the bottom zone of $22 over the past few sessions. Moreover, the price action shows a movement setback. After the trendline breakout, EGLD price sharply cruised above the 200-day EMA, in a massive bullish candlestick.
The RSI curve stretched from the neutral region to the overbought zone and witnessed a positive divergence on the chart, suggesting an impressive bullish outlook for the upcoming sessions. Furthermore, the MACD indicator shows a bullish crossover and green bars on the histogram, meaning that the EGLD price may claim $80, followed by $90, soon.
EGLD Price Escaped 100 Day EMA on Weekly Chart
 EGLD Price Prediction: EGLD Price Reached Blue Sky Zone Above $50">
On the weekly chart, EGLD price broke out and has escaped the 100-day EMA, confirming the bulls’ dominance. Moreover, the price action suggests that sellers are trapped and are covering their positions, whereas bulls look aggressive and persist in adding long positions.
Summary
EGLD price climbed above the psychological mark of $50 swiftly and has remained in the blue sky zone over the past few sessions. The technicals suggest that buyers have gained traction and persisted in accumulation, resulting in the formation of the higher highs pattern over the past number of sessions.
Technical Levels
Support Levels: $60 and $55
Resistance Levels: $65 and $70
Disclaimer
The views and opinions stated by the author or any other person named in this article are for informational purposes only and do not constitute financial, investment, or other advice. Investing in or trading crypto or stocks comes with a risk of financial loss.
With a background in journalism, Ritika Sharma has worked with many reputed media firms focusing on general news such as politics and crime. She joined The Coin Republic as a reporter for crypto, and found a great passion for cryptocurrency, Web3, NFTs and other digital assets. She spends a lot of time researching and delving deeper into these concepts around the clock, and is a strong advocate for women in STEM.
 thecoinrepublic.com
