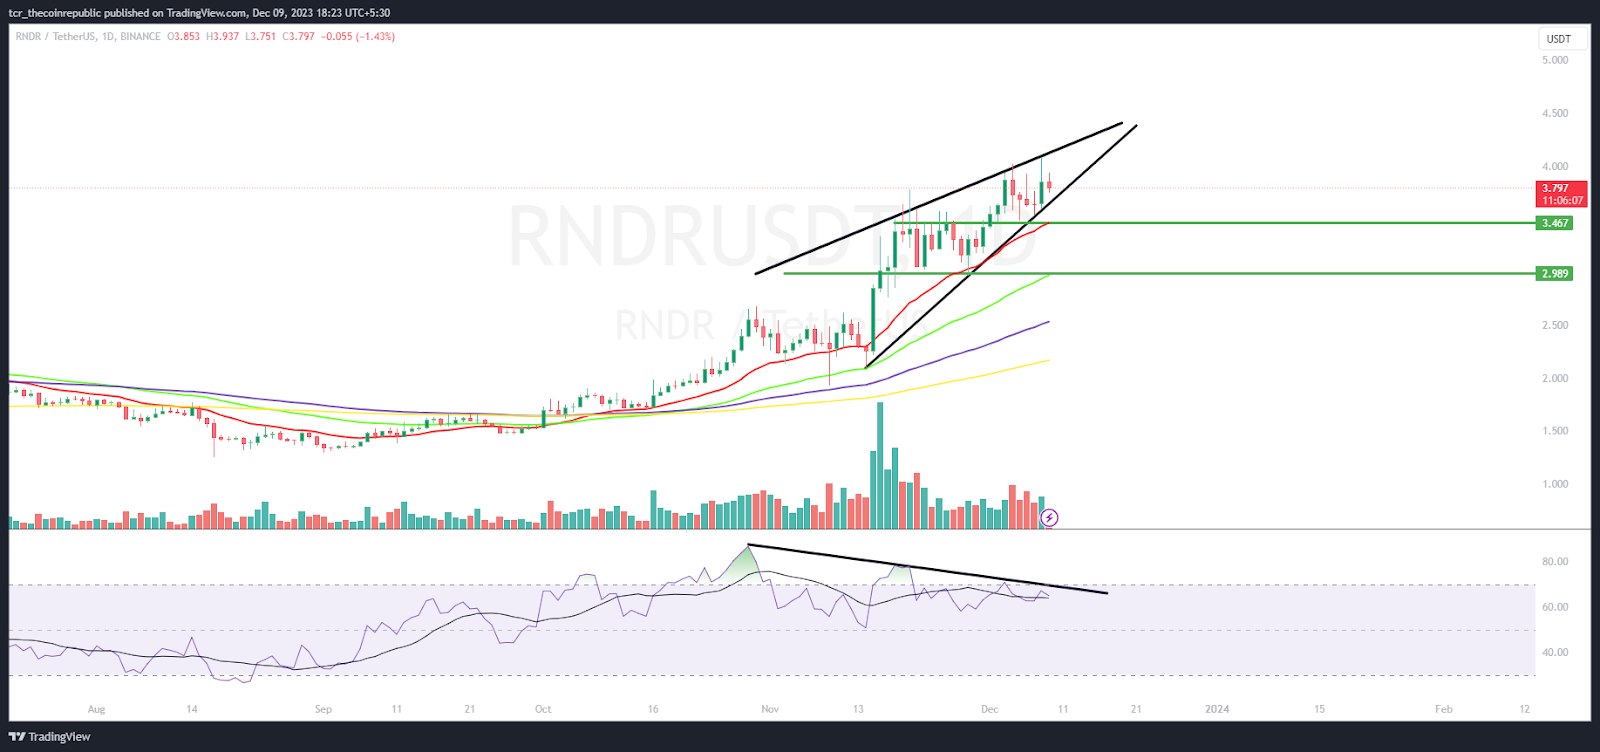
- 1 RNDR crypto produced a golden crossover on the chart.
- 2 RNDR price persisted in forming the higher highs sequence.
RNDR price registered a massive range breakout after a long time and surged over 90% this month, signifying bulls’ comeback on the chart. Moreover, the token has displayed a golden crossover, and the RNDR price replicates accumulation in the recent sessions. The technicals indicate that the RNDR token surpassed the range above $2.80, as buyers continue to accumulate.
RNDR price has escaped the significant moving averages and witnessed massive bounce from the bottom zone of 100-day EMA. Additionally, the price action displays bullish momentum and replicates impressive performance, and buyers dominate the battle. On the chart, the RNDR token has held the lower trendline of the falling wedge pattern and held the gains decisively.
The live price of the RNDR token is $3.82, with an intraday gain of 0.20%, showing neutrality on the charts. Moreover, the trading volume increased by 7.06% to $194.42 Million. However, the pair of RNDR/BTC is at 0.0000861 BTC, and the market cap is $2.01 Billion. Analysts have maintained a neutral rating and suggest a growth outlook for the upcoming sessions.
RNDR on Daily Chart Displays Rising Wedge Pattern

On the daily chart, RNDR price has exhibited a vertical spike and claimed a bullish trajectory in the recent sessions. The token has escaped the critical hurdle of $3.00 in the past weeks and is heading to retest the round mark of $4.00. However, the chart formation displays a rising wedge pattern, which suggests that if the RNDR token price slips below the lower trendline, it may lead to a retracement toward the immediate support mark of $3.50.
The RSI curve stayed in the overbought zone and formed a negative divergence, which signals that the RNDR price may face selling pressure in the following sessions. The MACD indicator showed a bearish crossover and formed red bars on the histogram, indicating a profit booking on the charts.
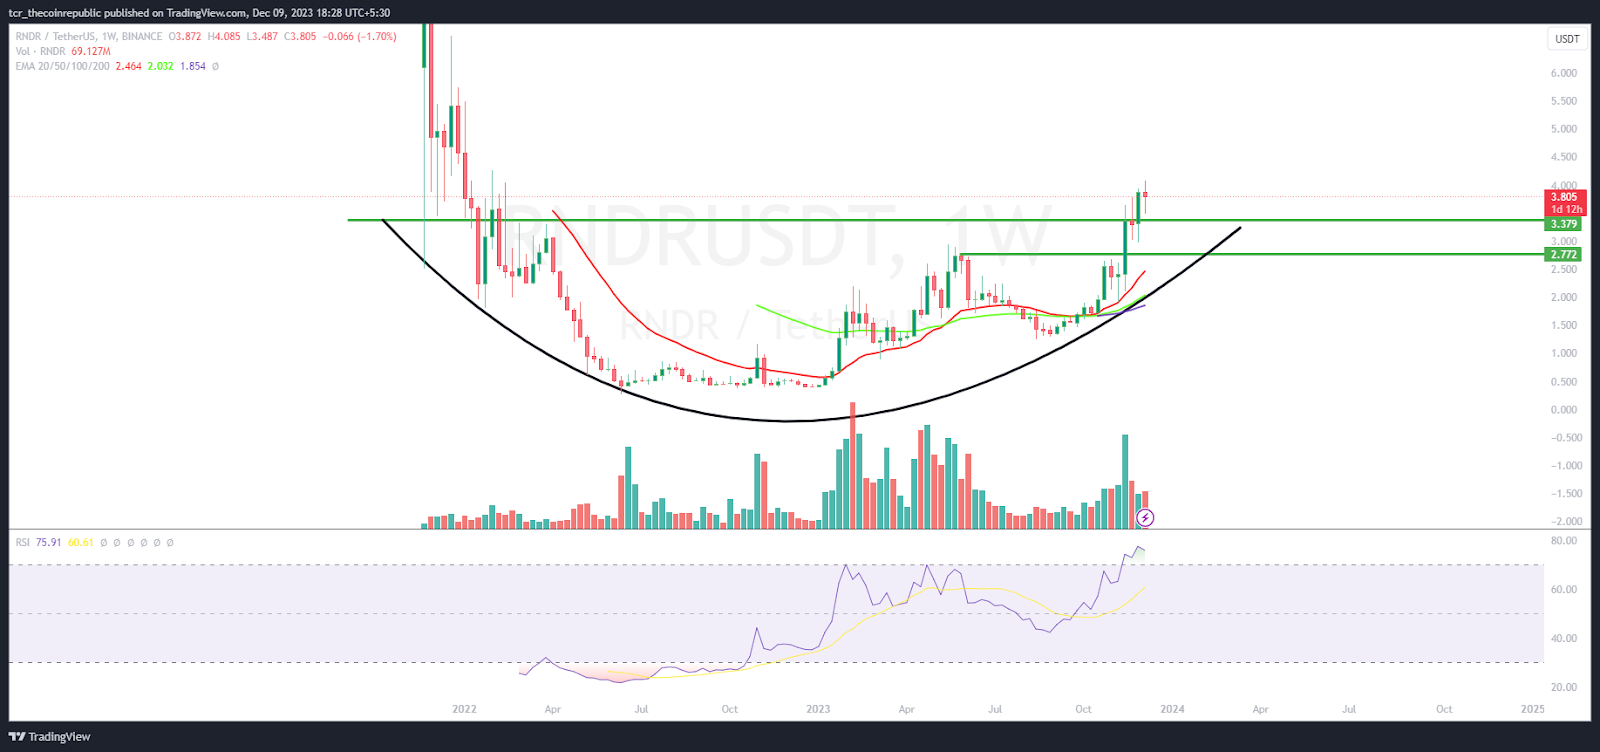
Weekly Charts Shows Rounding Bottom Pattern

On the weekly chart, the RNDR token price has formed a rounding bottom pattern and healed from the bottom mark of $1.20, delivering a reversal in the past few sessions. RNDR token observed a range breakout and a sharp pullback from the 20-day EMA.
Summary
RNDR price surpassed the critical range of $3.00 and witnessed a massive bounce in the past few trading sessions. Render token has surged over 90% this month. Buyers are expected to surpass the immediate hurdle of $4.00 soon.
Technical Levels
Support Levels: $3.80 and $3.20
Resistance Levels: $4.10 and $4.50
Disclaimer
The views and opinions stated by the author or any other person named in this article are for informational purposes only and do not constitute financial, investment, or other advice. Investing in or trading crypto or stocks comes with a risk of financial loss.
Nancy J. Allen is a crypto enthusiast, with a major in macroeconomics and minor in business statistics. She believes that cryptocurrencies inspire people to be their own banks, and step aside from traditional monetary exchange systems. She is also intrigued by blockchain technology and its functioning. She frequently researches, and posts content on the top altcoins, their theoretical working principles and technical price predictions.
 thecoinrepublic.com