The cryptocurrency market continues to look strong after a scare that has left the cryptocurrency market wondering where the market could be heading in the coming weeks and months after the United States (US) Department Of Justice (DOJ) fined Binance $4.3 one of the largest cryptocurrency exchange as a result of compliance violations.
Its top official, Changpeng Zhao (CZ), resigned from its role, leaving many traders and investors worried about how this could affect the market after the price of Bitcoin and Binance Coin, the official native coin for its Binance ecosystem, saw over 10% drop in price.
The new week saw some price ranges across the cryptocurrency market as the price of Bitcoin, the number one cryptocurrency asset by market capitalization, held its ground strong, giving many traders and investors a sense that the market is continuing in its uptrend.
The market looks ready for a rebound after seeing some great volume and price action displayed by Bitcoin, as there has been news of Bitcoin Exchange-traded Funds (BTC ETF) scheduled to be approved in the early weeks of January 2024.
On-chain data shows that the market looks healthier than expected as the market looks ready to rally with weekly top 5 altcoins (LINK, INJ, XRP, MATIC, DOGE) looking to continue producing high-profit returns for its traders and investors ahead of a new week filled with so much optimism.
The data from Coin360.com shows the market looks bullish as the market reacted strongly following CZ and Binance saga, creating much fear and uncertainty in the crypto space as statistics show the performance of Bitcoin and other weekly top 5 altcoins (LINK, INJ, XRP, MATIC, DOGE) could be heading in key area of interest as prices aim to break past yearly highs.
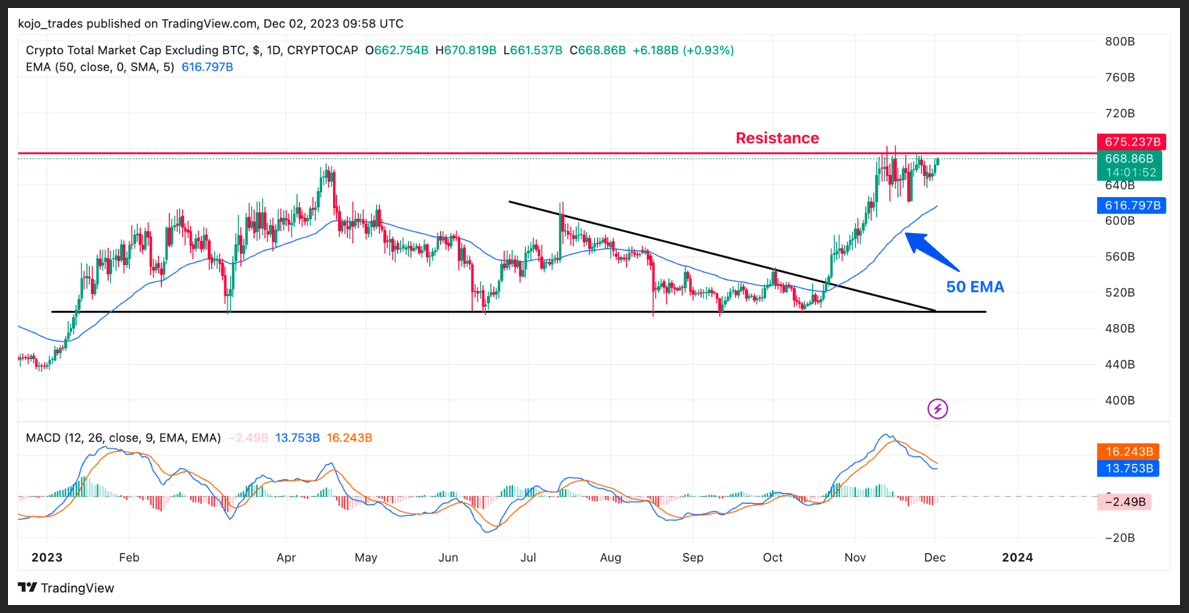
After forming good support for around 400 billion market cap for altcoins excluding Bitcoin, the price of altcoins by market cap rallied to a high of 670 billion, where the total market cap for altcoins faces a key decision to break higher.
If the price of the total market cap by altcoins breaks above 670 billion, we could see a higher price trend for the first time in over one and a half years after a prolonged bear market that has affected the prices of altcoins, including Bitcoin.
After suffering a price scare to a region of $35,400 in previous weeks, many traders and analysts kept calling for a potential drop in Bitcoin price to $32,000. The price of Bitcoin bounced from that region to a high of $36,500, where its price continued to be in a price range for weeks.
The price of Bitcoin not only demonstrated its bullish strength around $37,300 but also showed bears could be doomed as the price has passed its phase of bearish dominance as bulls continue to dominate the price of Bitcoin as price broke above its key resistance of $37,800.
The price of Bitcoin has continued to trade above 50-day, 100-day, and 200-day Exponential Moving Averages (50-day, 100-day, and 200-day EMA), respectively, on lower and higher timeframes, suggesting much price control by buyers and institutions willing to buy into this asset.
In recent news, Micheal Saylor announced MicroStrategy of acquiring an additional 16,130 BTC to its total number of Bitcoin owned as many feared the price of Bitcoin could make a major retracement, suggesting MicroStrategy’s purchase usually sparked the top.
This was not the case as the price of Bitcoin remained strong, aimed at a high of $40,000, where the price could reach a new yearly high after closing the monthly candle high for close to two years in a bearish market.
Despite much hype around Bitcoin, the price of Ethereum continues to lag behind its price as Ethereum trades just above its $2,100 mark as the price faces key resistance to trend higher around $2,150.
If the price of Ethereum breaks above this resistance, we could see the price rally to a high of $2,300 to $2,400, where the price of Ethereum could face major resistance as the price creates a new yearly high.
Ethereum’s price sits comfortably above key support areas with good buy volume as the price of altcoins, including our weekly top 5 altcoins (LINK, INJ, XRP, MATIC, DOGE), look to rally high with its price.
Let us discuss some technical analysis surrounding our weekly top 5 altcoins (LINK, INJ, XRP, MATIC, DOGE) that require paying attention to them as the new week unfolds with so many opportunities.
Chainlink (LINK) Price Analysis as a Weekly Top 5 Altcoins to Watch
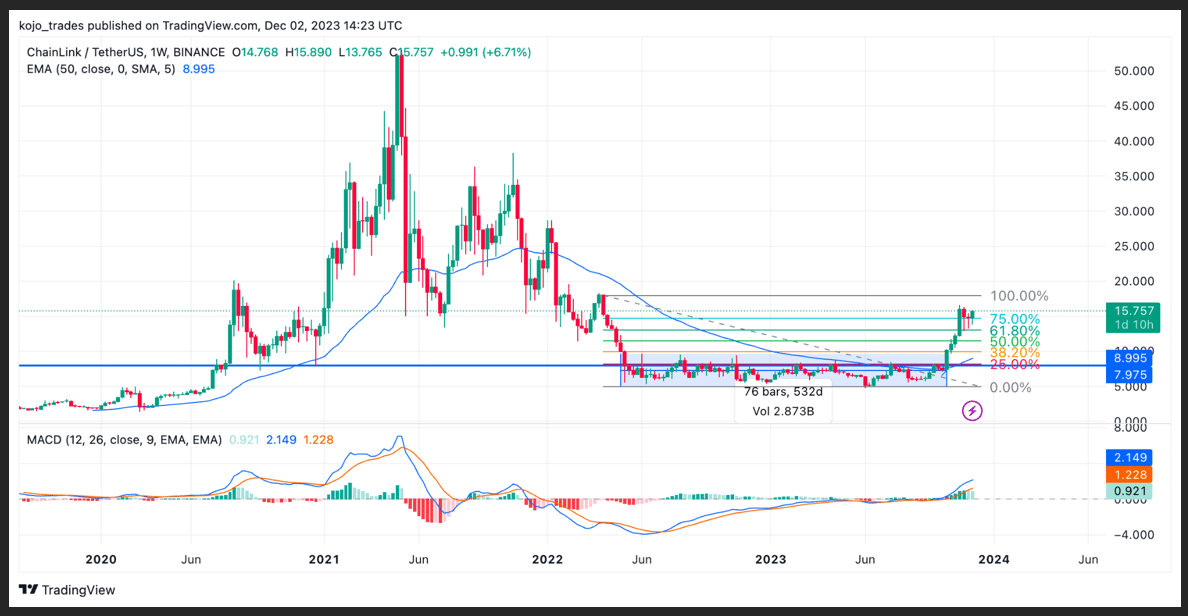
Chainlink (LINK) has recently seen a consistent price rally as the price broke out of its accumulation phase of over 500 days, leading to many traders and investors accumulating LINK/USDT ahead of its major breakout.
Chainlink’s price has seen much surge after the launch of Chainlink’s version 2 staking as on-chain data suggest over 200 wallets have strategically accumulated LINK with over $50 million worth of LINK/USDT price accumulated in this range.
After the price broke out from its range around $9.5, the price of LINK/USDT has rallied by over 150% in the last eight weeks as on-chain data suggest the price of LINK/USDT remains highly undervalued at this range as price aims to rally to a high of $30.
The price of LINK/USDT currently trades above $15.5 above its 75% Fibonacci Retracement value after dropping to a region of $13 as the price bounced swiftly to reclaim $15 as the price aims to rally higher to $25 and above.
If the price of LINK/USDT holds above 75% FIB value, we could see the price trend higher; if the price of LINK/USDT breaks lower, we could see the price retest $13, where strong support has been formed just above the 50-day EMA acting as support for the trend.
The volume displayed by LINK/USDT is commendable because its Moving Average Convergence Divergence (MACD) and its Relative Strength Index (RSI) all point to the fact that the price could continue with its uptrend rally.
Major LINK/USDT support zone – $13
Major LINK/USDT resistance zone – $25
MACD trend – Bullish
Ripple’s (XRP) Price Chart Analysis on the Daily Timeframe
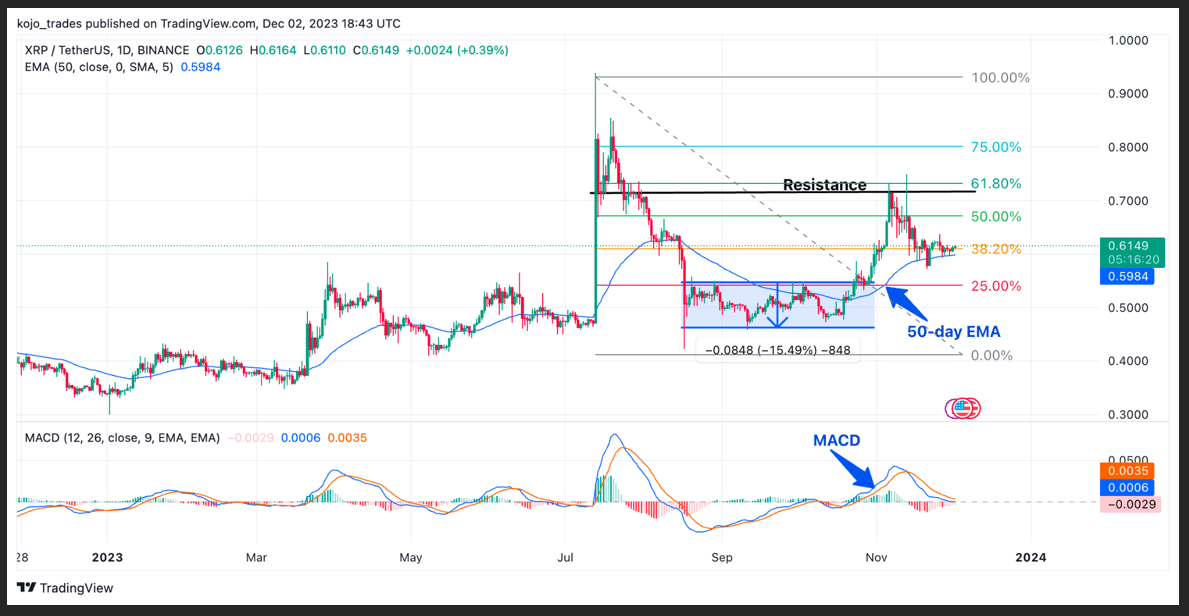
The crypto market continues to look super bullish on lower and higher timeframes as altcoins continue to produce mouth-watering gains. Still, the price of Ripple (XRP) continues to lag in its price movement just above the key region of interest of $0.6.
Despite its slow price action, the price of XRP/USDT has been tipped as one of the best cryptocurrency assets to hold under $1, as many traders and analysts believe it’s just a matter of time before the price of XRP/USDT catches up with the rest of the market and outperform beyond expectations of many.
Although the cryptocurrency market suffered a scare as many assets suffered price rejection, the price of XRP/USDT has held pretty well above its 38.2% FIB value, which remains key to price rallying higher.
The price of XRP/USDT at $0.6 corresponds with the 50-day EMA acting as support as bulls continue to protect this region to avoid bears from pushing the price of XRP/USDT back into its range price of $0.5 to $0.55.
If the price of XRP/USDT holds above $0.6, this remains a safe zone for bulls as the price could rally from this region high to a region of $0.75, where the price has struggled on several occasions from breaking high above.
Ripple’s (XRP) bulls need to step more into buy pressure to push the price of XRP/USDT past the region of $0.75. If the price breaks above $0.75, we could see XRP/USDT hit $1 and rally high to a region of $2 and a possible $3.
The MACD and RSI on the daily and higher timeframes for XRP/USDT haven’t been encouraging with little price action.
Major XRP/USDT support zone – $0.6
Major XRP/USDT resistance zone – $0.75
MACD trend – Neutral
Injective Protocol Price Analysis as a Weekly Top 5 Altcoin to Watch
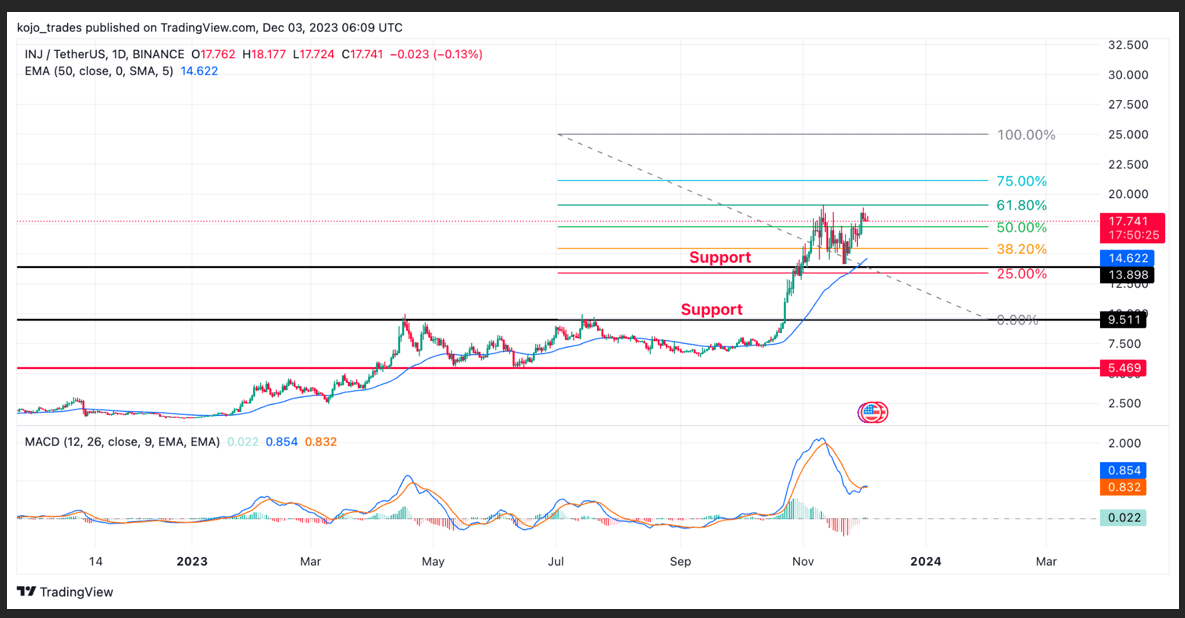
Injective Protocol remains one of the biggest performers in 2023 despite the tough bearish run, as the price has overwhelmed the expectations of many traders and investors, rallying from a low of $2 to a high of $18 with over 800% for this year.
Considering its use case and huge backing from partners, community, and institutions heavily invested in Injective Protocol, this altcoin is not a surprise to be among the weekly top 5 altcoins to watch as we head into a new week field with expectations for the market.
After rallying to a high of $18, the price of INJ/USDT suffered a minor price decline to a region of $13.5, where the price formed support as the price bounced from this region to trend higher to a region of $17.8.
The price of INJ/USDT currently trades above the 38.2% FIB value, and the 50-day EMA acts as support with good volume as the price aims to reclaim the $25 high acting as a previous all-time high as the price is a stone’s throw from this region.
With bullish price action remaining intact, we could see the price of INJ/USDT trading higher than this region as its daily MACD and RSI all point to bulls dominating the price of INJ/USDT.
Major INJ/USDT support zone – $13.5
Major INJ/USDT resistance zone – $25
MACD trend – Bullish
Polygon Matic (MATIC) Price Analysis on the Daily Timeframe
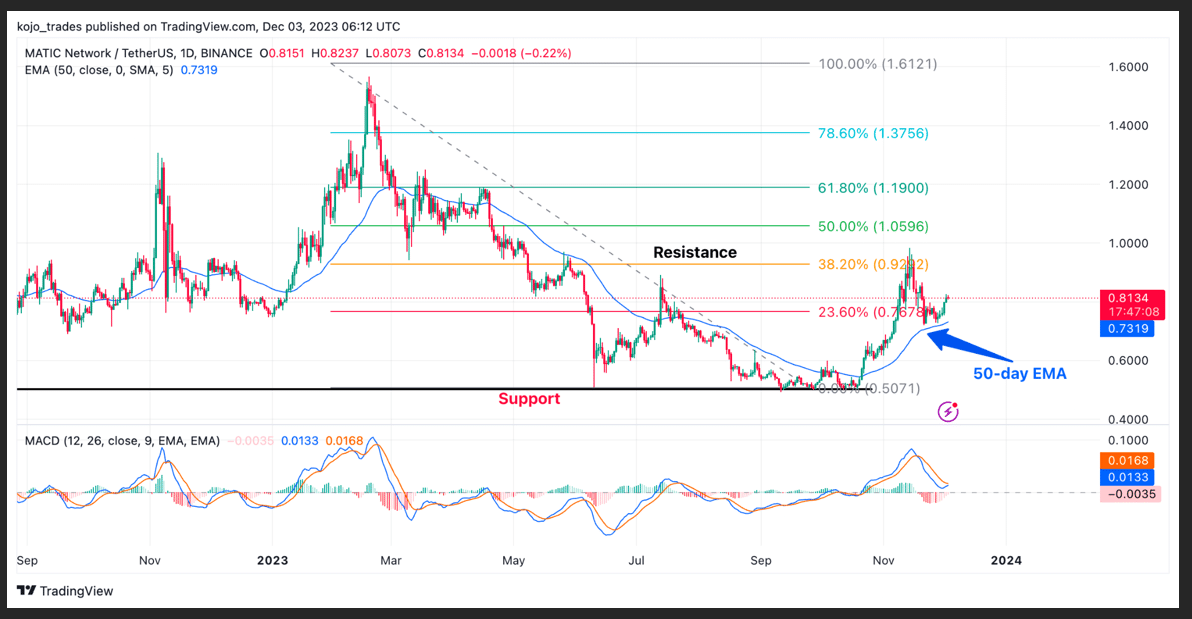
Polygon Matic (MATIC) has remained a concern for many traders and investors as the price remained less bullish despite the market looking primed for a mega bull run as the price of MATIC/USDT continued to struggle to break above $0.9.
The uncertainty surrounding Binance in recent times saw the price of MATIC/USDT drop from its high of $0.93 to a low of $0.7, where the price of MATIC/USDT found support just above its 25% FIB value and its 50-day EMA.
The price of MATIC/USDT faces a major resistance of around $0.93 as the price has struggled to break above this region on several occasions despite the bullish market, with many altcoins looking to rally higher.
Many investors see the current price for MATIC/USDT as undervalued, considering how hugely invested many companies are in its project with many attractive partnerships. The currency price of MATIC/USDT is a gem for many.
If the price of MATIC/USDT breaks comfortably above $1, we could see the price rally high to a region of $1.5, where the price could face another yearly high resistance. A break a close for MATIC/USDT above $1 and $1.5 could mean a bullish price action to a high of $3.
Polygon Matic’s MACD and RSI look neutral as there has been little price action accompanying its price, with much need for bulls to push the price of MATIC/USDT higher above this region.
Major MATIC/USDT support zone – $0.7
Major MATIC/USDT resistance zone – $0.93
MACD trend – Neutral
Dogecoin (DOGE) Price Analysis as a Weekly Top 5 Altcoin
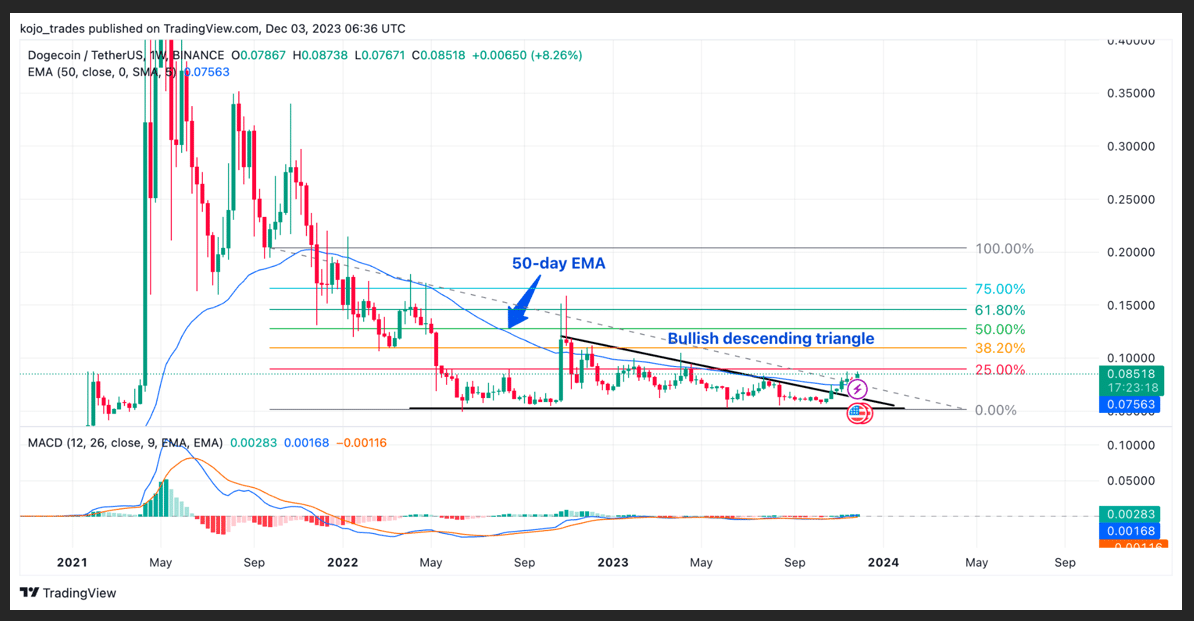
Dogecoin (DOGE), just like other altcoins and memecoins, has remained in a lagging position by its price as the memecoin king is yet to make any huge price rally after suffering from the bear market and its price remaining in range price actions.
The price of DOGE/USDT formed a bullish descending triangle during its range price movement as there has been a breakout from a bullish descending triangle above $0.084 as the price faces a key resistance to trade above $0.085.
If the price of DOGE/USDT breaks above the $0.085 price resistance, which corresponds to the 25% FIB value on the weekly timeframe, it could mean game on for the memecoin community DOGE/USDT would be set to make its famous price rally that comes with huge gains.
DOGE/USDT remains an asset to buy below $1 as it holds much historical price gain in previous bull markets, with the current market not looking to be an exception for its price as it trades just above its 50-day EMA with much bullish price actions on its MACD and RSI indicators.
If the price of DOGE/USDT breaks above $0.085 and $0.092, we could see the price rally high within a short time as there is a need to pay close attention to how the price of DOGE/USDT develops in the coming days and
Major DOGE/USDT support zone – $0.065
Major DOGE/USDT resistance zone – $0.085-$0.092
MACD trend – Bullish
 thecryptobasic.com
