Shiba Inu (SHIB) price has been falling over the past week and has been trapped within the moving average lines.
Shiba Inu price long-term forecast: fluctuation range
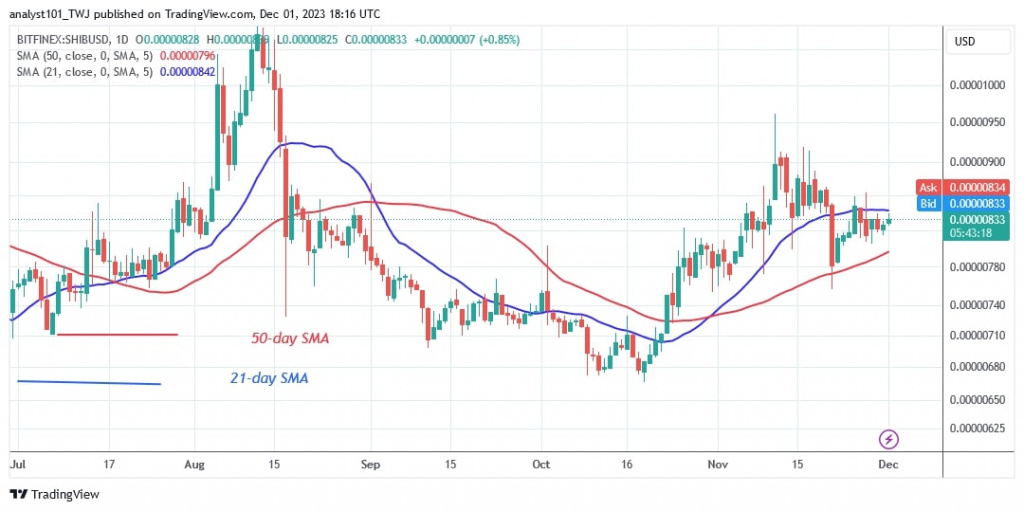
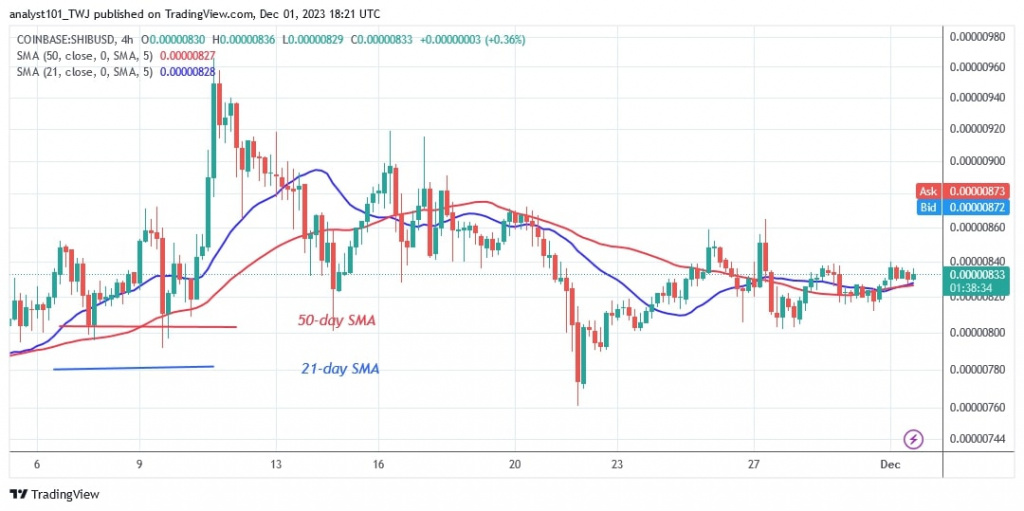
The price of Shiba Inu has been stuck between the moving average lines since November 21. The price of the cryptocurrency tested the 21-day SMA twice on November 25 and November 27, but was beaten back both times.
The altcoin is currently trading at $0.00000813, which is in the middle of the moving average lines.
The coin's price is also fluctuating, ranging between $0.00000800 and $0.00000860. Shiba Inu will resume its uptrend if buyers break through the resistance at $0.00000860 and the 21-day simple moving average. This will drive the altcoin's price to historic highs of $0.00000950 and $0.00001100. If the bears break through the 50-day simple moving average, the altcoin risks falling.
Analysis of the Shiba Inu indicator
The price of the cryptocurrency will fluctuate as it is trapped between the moving average lines. Moreover, the price movement has been restricted by the presence of doji candlesticks. The moving average lines have been sloping horizontally since the uptrend ended.
Technical indicators
Key resistance levels: $0.00001200, $0.00001300, $0.00001400
Key Support levels: $0.00000600, $0.00000550, $0.00000450

What is the next move for Shiba Inu?
Doji candlesticks suggest that the cryptocurrency is likely to range for a few days. The 21-day SMA is the point where the upward correction got stuck as the altcoin continues its rangebound trend. The altcoin will trend higher if the resistance levels of $0.00000840 and $0.00000860 are broken.

Disclaimer. This analysis and forecast are the personal opinions of the author and are not a recommendation to buy or sell cryptocurrency and should not be viewed as an endorsement by CoinIdol.com. Readers should do their research before investing in funds.
 coinidol.com
