- 1 $GRT token chart reveals a halt and is struggling to top the prompt hurdle of $0.1600.
- 2 Buyers are yielding their grip and attempting to hold on to the 20 day EMA mark.
The Graph ($GRT token) forgot to scratch the resistance mark of $0.1700 and formed a double-top pattern. Moreover, the price action witnessed sellers’ attraction and buyers started securing profits because of the fear of losing out, which led to the retracement to the $0.1400 mark. However, the $GRT token price is still above the key moving averages and near neutrality.
$GRT token price took a pause and showed a healthy retracement in the past sessions. Furthermore, the $GRT token price stayed above the 50% Fibonacci retracement zone and if the token sustains above the 20-day EMA mark, it will recuperate and may retest the swing high of $0.1800, followed by $0.2000.
$GRT token has the prospect to cross the nearest burden of $0.1600 and may reach the bluesky zone above $0.2000 in the next few months.
The live price of the $GRT token is $0.1413 with an intraday drop of 6.01% showing neutrality on the charts. Moreover, the trading volume increased by 7.22% to $104.19 Million and the pair of $GRT/$BTC is at 0.00000385 $BTC. However, the market cap of Graph token is $1.02 Billion. Analysts have maintained a neutral rating and suggest a growth outlook for the upcoming sessions.
Will Graph ($GRT) Token Retain $0.1800 Mark?
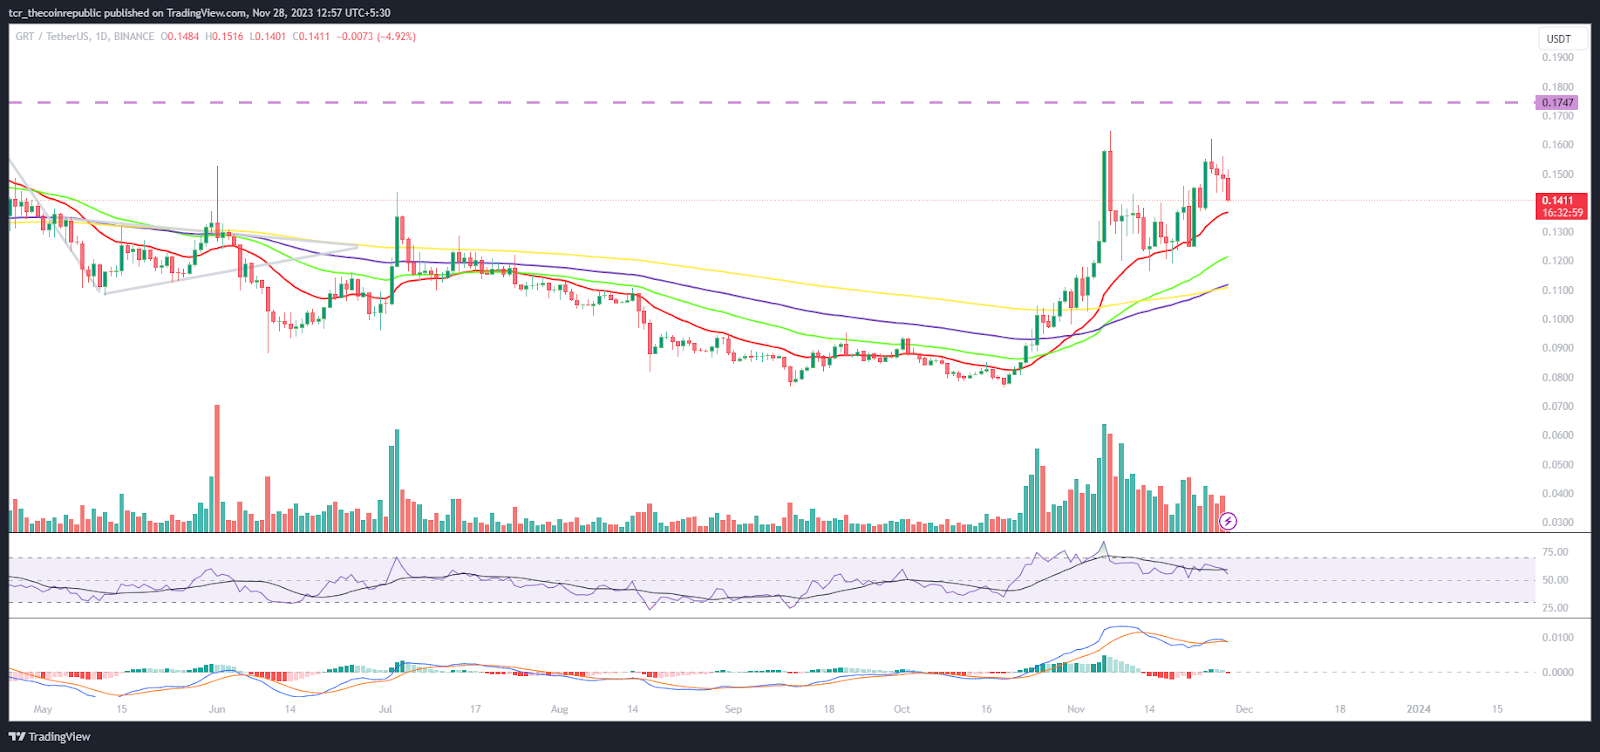
On the daily chart, the $GRT token price produced a double top pattern and encountered rejection from the resistance mark of $0.1700. The technicals are indicating that the $GRT token is trading close to the supply zone of $0.1700, from where a throwback was noted. Additionally, the $GRT token has shown a tremendous vertical rally from the bottom zone of $0.0800 and needs a healthy retracement to continue the sensation.
The RSI curve stayed near 62, forming a positive divergence. This suggests that if $GRT maintains the grip above 20-day EMA, it will soon reach $0.1800.
The MACD indicator showed a convergence of the MA line with the signal line and highlighted the volatility.
Weekly Charts Shows Double Bottom Formation
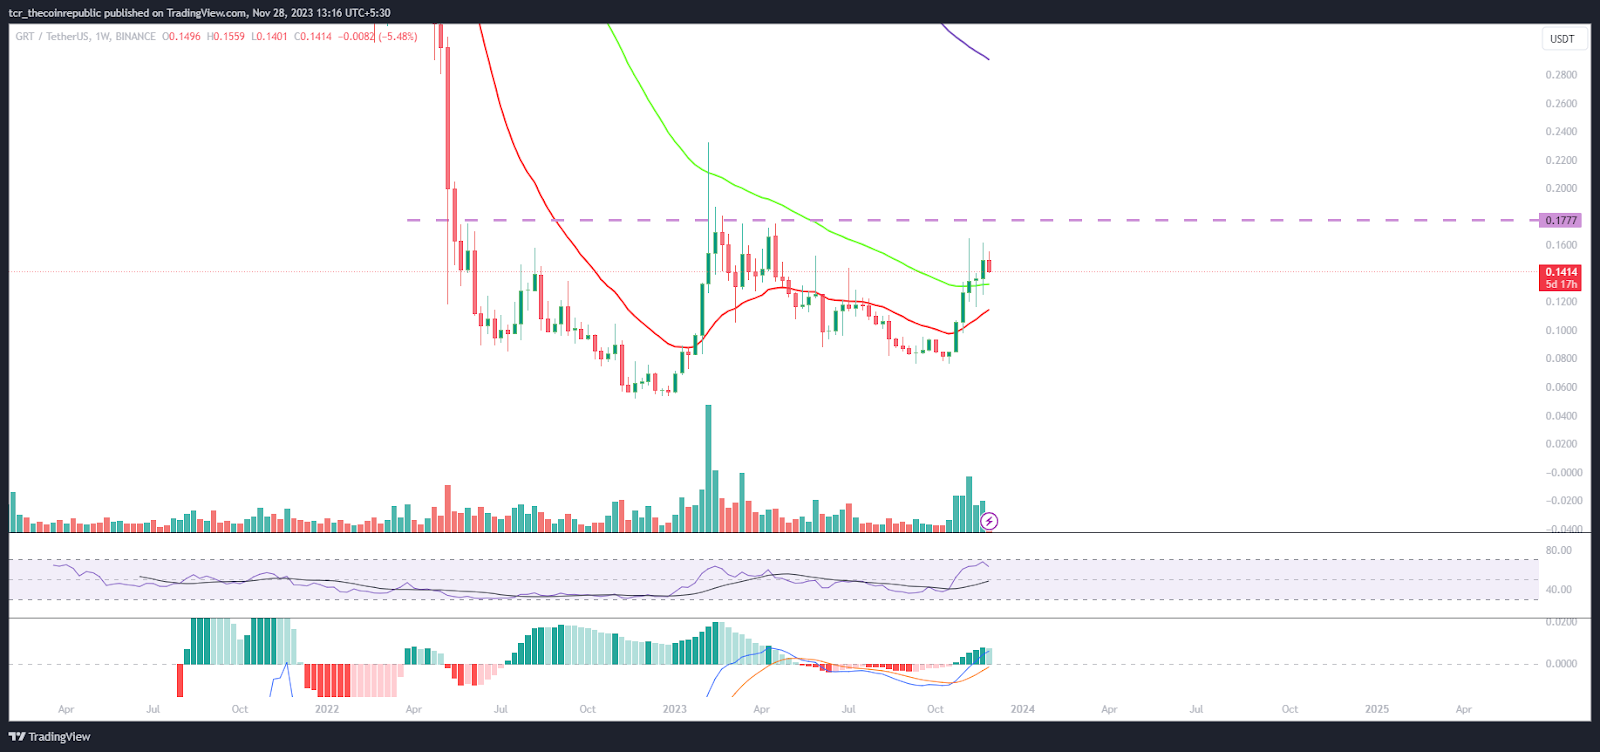
On the weekly chart, the $GRT token formed a double bottom pattern and surpassed the 50-day EMA mark. Furthermore, the $GRT token rebounded from the support zone of $0.0750 highlighting buyers’ accumulation.
Summary
Graph token price showcased a double top pattern and faced rejection from the supply zone of $0.1650 which is acting as a strong barrier for the bulls. However, the token sustained above the key moving averages, highlighting the buying momentum. However, the token needs a healthy retracement to the 20-day EMA.
Technical Levels
Support Levels: $0.1400 and $0.1340
Resistance Levels: $0.1700 and $0.1900
Disclaimer
The views and opinions stated by the author or any other person named in this article are for informational purposes only and do not constitute financial, investment, or other advice. Investing in or trading crypto or stocks comes with a risk of financial loss.
Adarsh Singh is a true connoisseur of Defi and Blockchain technologies, who left his job at a “Big 4” multinational finance firm to pursue crypto and $NFT trading full-time. He has a strong background in finance, with MBA from a prestigious B-school. He delves deep into these innovative fields, unraveling their intricacies. Uncovering hidden gems, be it coins, tokens or NFTs, is his expertise. NFTs drive deep interest for him, and his creative analysis of NFTs opens up engaging narratives. He strives to bring decentralized digital assets accessible to the masses.Adarsh Singh is a true connoisseur of Defi and Blockchain technologies, who left his job at a “Big 4” multinational finance firm to pursue crypto and $NFT trading full-time. He has a strong background in finance, with MBA from a prestigious B-school. He delves deep into these innovative fields, unraveling their intricacies. Uncovering hidden gems, be it coins, tokens or NFTs, is his expertise. NFTs drive deep interest for him, and his creative analysis of NFTs opens up engaging narratives. He strives to bring decentralized digital assets accessible to the masses.