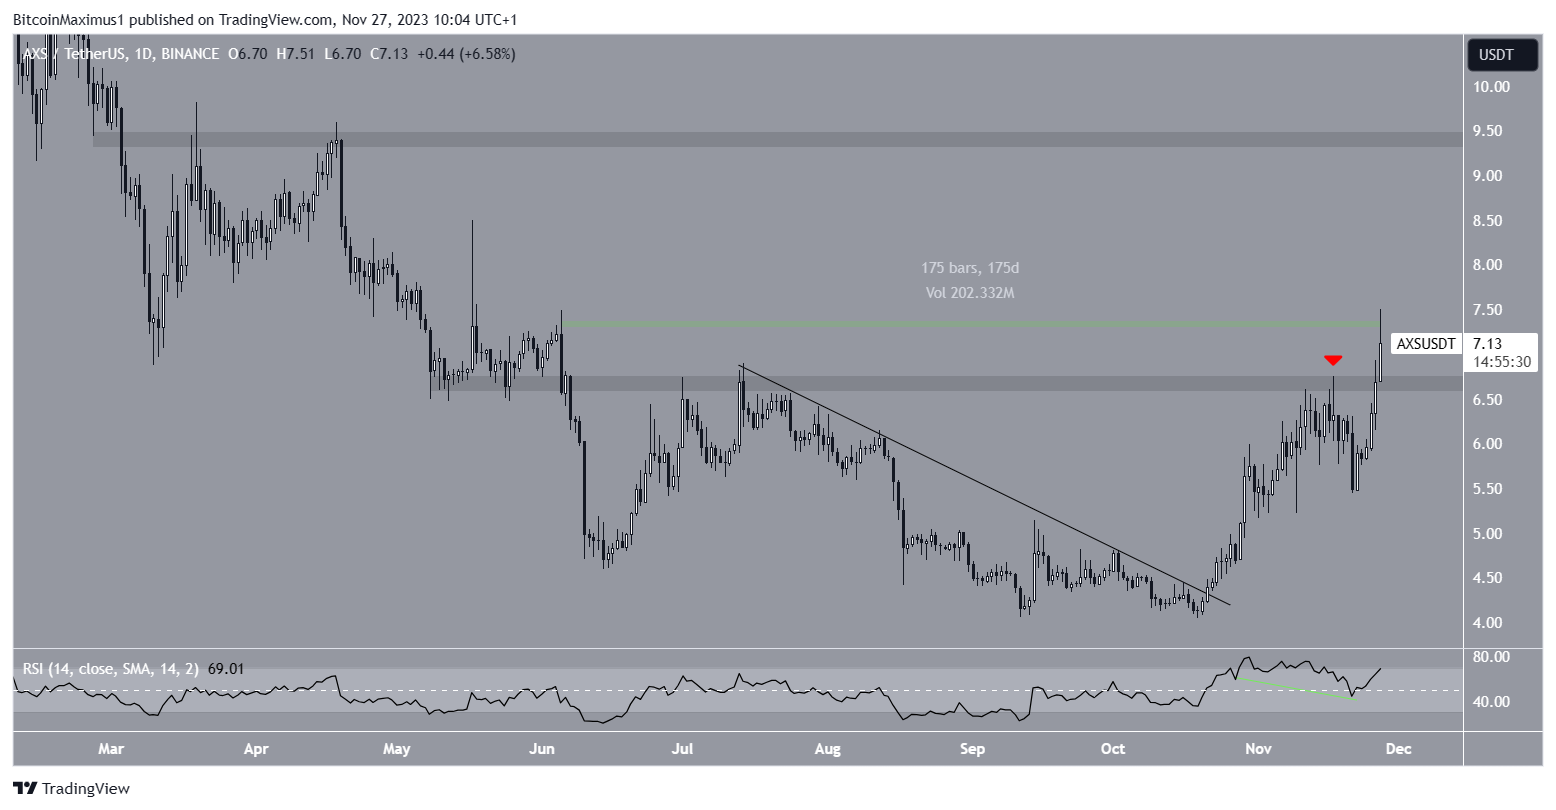
The Axie Infinity (AXS) price reached a high of $7.51 today before falling slightly. It was the highest price since June 5.
During the ascent, the price cleared a critical horizontal resistance area. Can the price sustain its momentum and move towards $10?
AXS Reaches 175-Day High
The daily timeframe technical analysis shows that the AXS price has increased rapidly since breaking out from a descending resistance trend line on October 21.
Initially, the price was rejected by a pivotal horizontal resistance area that has stood since June (red icon). However, the AXS price regained its footing shortly afterward and broke out today. The price reached a high of $7.51 before a small drop.

Market traders use the Relative Strength Index (RSI) as a momentum indicator to identify overbought or oversold conditions and to decide whether to accumulate or sell an asset.
Readings above 50 and an upward trend indicate that bulls still have an advantage, whereas readings below 50 suggest the opposite.
The RSI is above 50 and increasing. Additionally, it has generated a hidden bullish divergence (green) a sign of trend continuation.
For BeInCrypto’s latest crypto market analysis, click here.
 beincrypto.com
