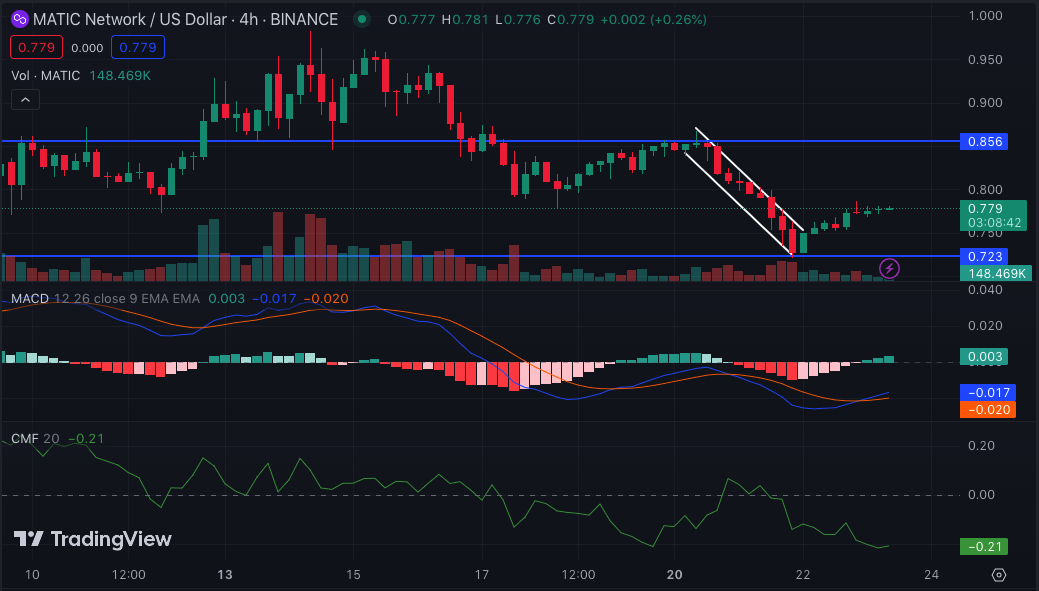
Crypto analyst Ali Martinez posted that Polygon (MATIC) has dropped below a vital supply as the token price dropped to $0.77. Martinez, in his post on X, noted that the $0.84 to $0.86 zone marked the threshold where a substantial number of addresses had accumulated approximately 4.13 billion MATIC.
The analyst also added that if MATIC’s price remains below the zone, there is a higher chance that the holders who acquired in the $0.84-$0.86 range may choose to sell to avoid potential losses, further decreasing the price of MATIC.
$MATIC has slipped below a crucial supply zone, spanning $0.84 to $0.86. In this range, 14,240 addresses hold over 4.13 billion #MATIC.
— Ali (@ali_charts) November 23, 2023
The longer the #Polygon price remains below this zone, the higher the likelihood that these holders might start selling to avoid incurring… pic.twitter.com/fc7eOmjOYp
Typically, supply zones are resistance levels where traders place sell orders to take profit. The opposite of this is the demand zone where traders accumulate while making buy orders. For MATIC to resist a further drop, the volume of buy orders needs to outweigh the 4.13 billion made between $0.84 and $0.86.
However, this seems largely unlikely because the 24-hour trading volume has decreased by 42.25%. On the MATIC/USD 4-hour chart, bears took control of the market direction between November 20 and 22.
During this period, the resistance at $0.85 plunged MATIC down to $0.72. However, recent buying pressure has pushed MATIC above $0.77. Nevertheless, the rise is not a confirmation that the uptrend will continue.
At press time, the Moving Average Convergence Divergence (MACD) was in the negative region. This reading implies that the 12-day EMA had diverged below the 26-day EMA, suggesting increasing bearish momentum.
Like the MACD, the Chaikin Money Flow (CMF) was also deeply entrenched in the negative region. This move into the red territory is a sign that there could be more selling pressure on the way. Should the CMF slide below -0.20, then MATIC may drop below $0.75.
No Sign of Bullish Dominance
The bearish tendencies were also reinforced by the Relative Strength Index (RSI). At press time, the RSI was 45.34, indicating how there has been some buying pressure responsible for moving MATIC to $0.77.
But the RSI reading’s inability to cross the 50.00 midpoint means bears can capitalize on the momentum and halt the uptrend. If this is the case, MATIC may drop below the $0.70 threshold. A look at the Directional Movement Index (DMI) also suggested the same.
At press time, the +DMI (green) was 15.34 and the -DMI (red) was 24. 61. The difference in the DMIs implies that sellers are currently outpacing buyers. Also, the Average Directional Index (ADX) was 31.11, indicating a strong directional movement in favor of the bears.
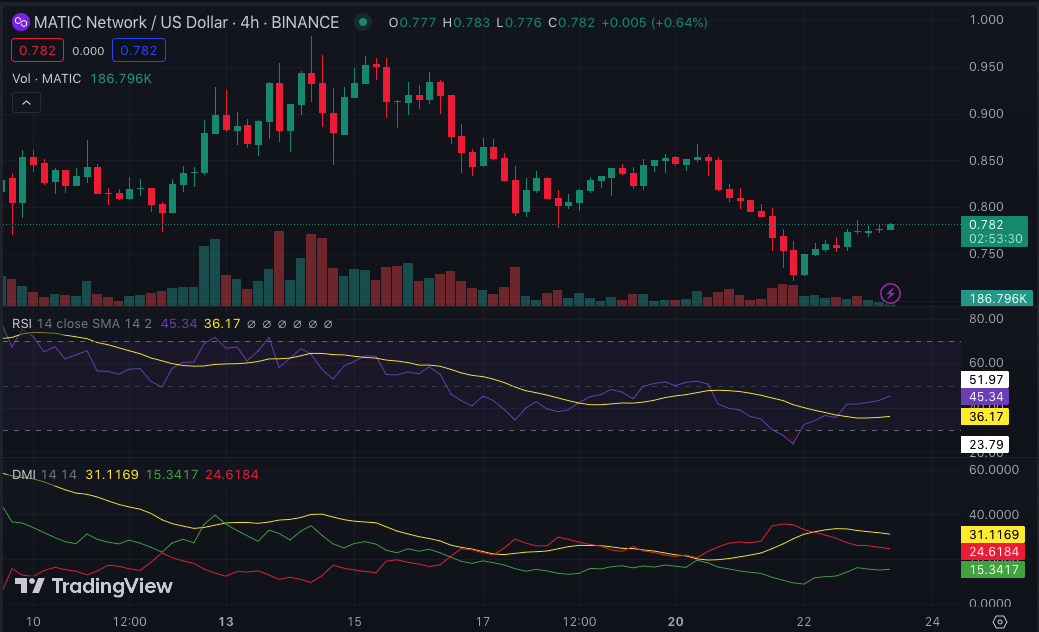
If the trend continues as analyzed above, MATIC may not surpass the $0.84 to $0.86 supply zone in the short term. Therefore, traders may need to overlook long positions for the token.
Disclaimer: The information presented in this article is for informational and educational purposes only. The article does not constitute financial advice or advice of any kind. Coin Edition is not responsible for any losses incurred as a result of the utilization of content, products, or services mentioned. Readers are advised to exercise caution before taking any action related to the company.