The Avalanche (AVAX) price broke out from a 455-day descending resistance trend line two weeks ago.
Despite the long-term breakout, the price failed to sustain its upward movement above a critical horizontal resistance area.
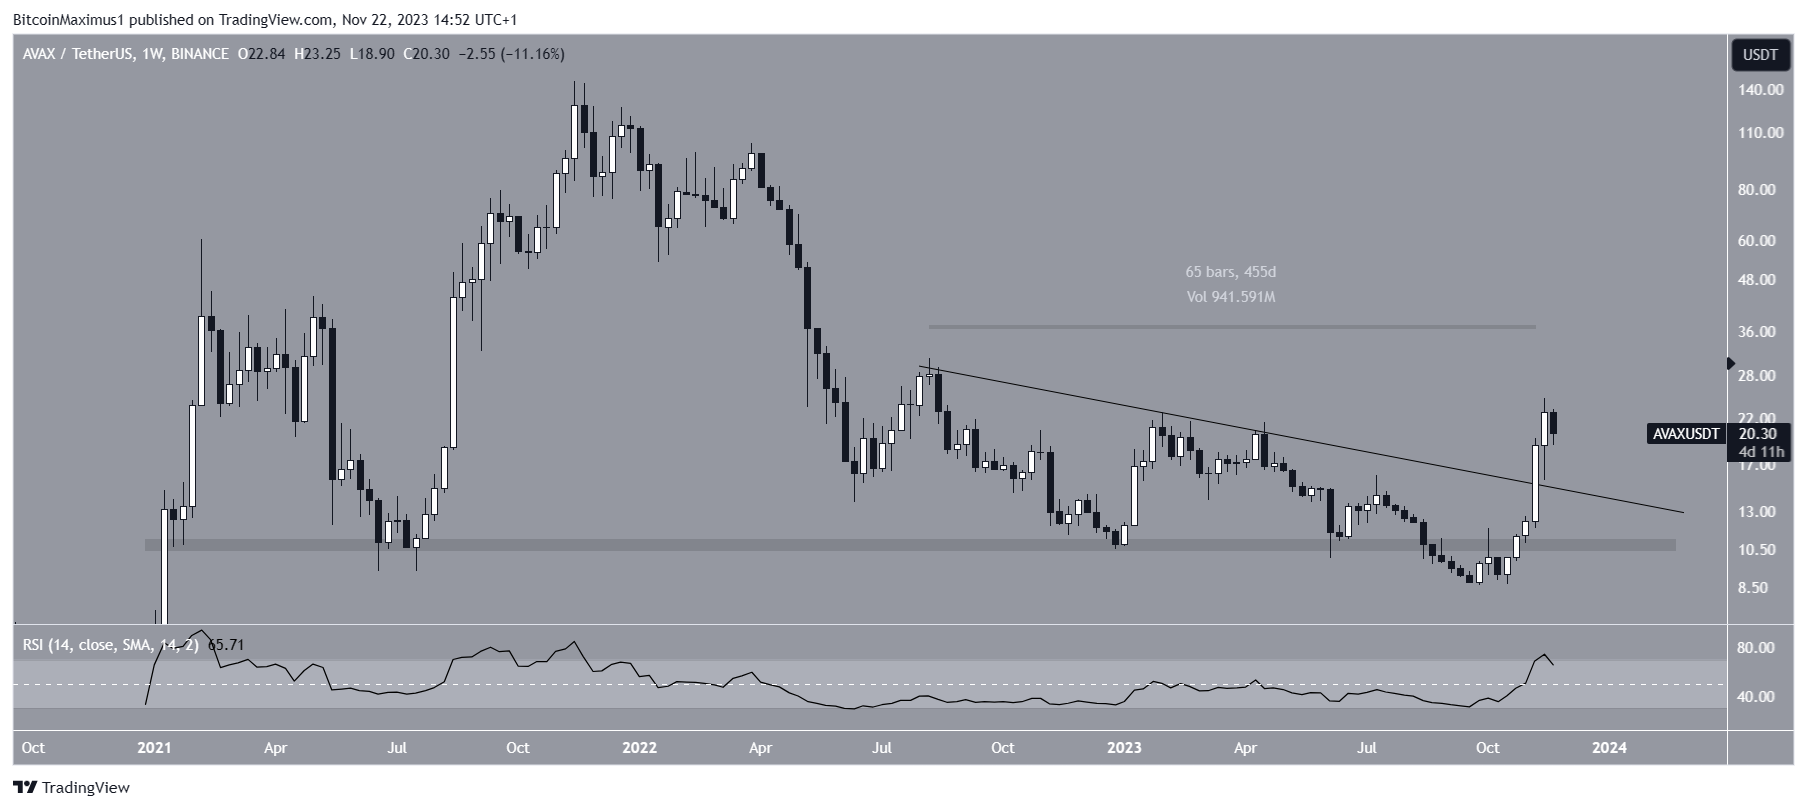
AVAX Breaks out From 455-Day Resistance
The weekly timeframe technical analysis shows that the AVAX price has fallen under a descending resistance trend line since August 2022. The trendline led to a low of $8.60.
During the decrease, AVAX seemingly broke down from a long-term horizontal support area in place since the start of 2021.
However, the ensuing increase caused a reclaim of this area, rendering the previous drop as only a deviation.
Two weeks ago, the AVAX price broke out from the descending resistance trend line, which had been in place for 455 days.
Market traders use the RSI as a momentum indicator to identify overbought or oversold conditions and to decide whether to accumulate or sell an asset.
Readings above 50 and an upward trend indicate that bulls still have an advantage, whereas readings below 50 suggest the opposite.
The RSI is above 50 and increasing – both positive signs.
What Are Analysts Saying?
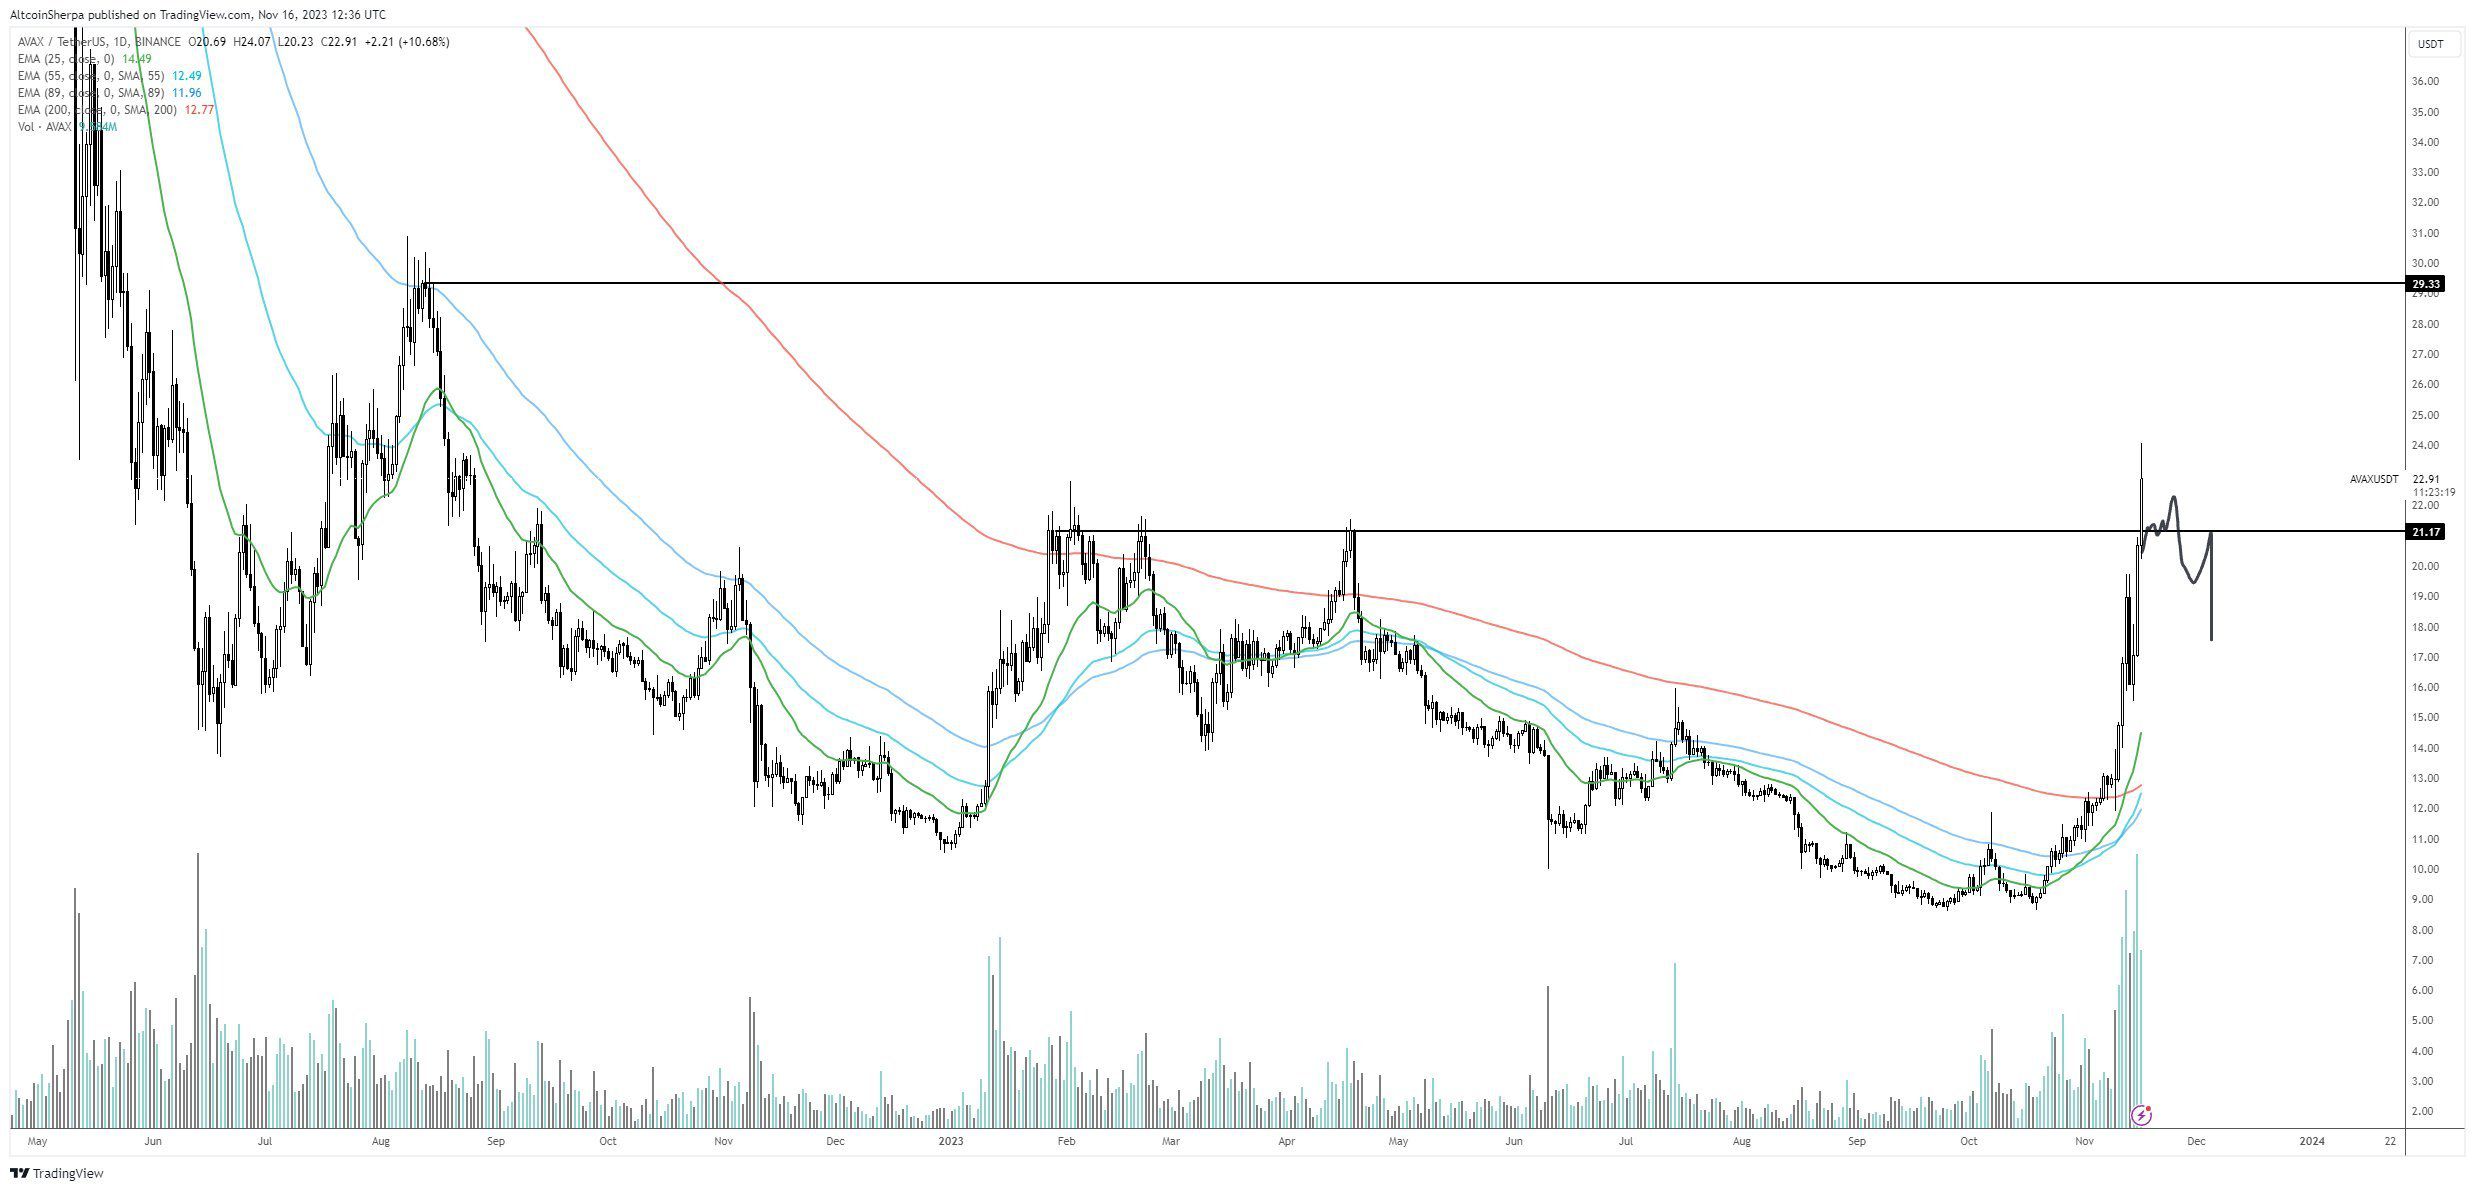
Cryptocurrency traders and analysts on X are bearish in the short-term AVAX price forecast.
AltcoinSherpa tweeted a chart that shows a short-term decrease since the price has deviated above the range high.
iWantCoinNews said that he is expecting a pullback since the price trades at a long-term resistance.
Expecting a pullback. Higher timeframe point of interest reached (1w -fvg). Daily timeframe reveals a bearish divergence on the RSI strengthening the idea price reverses.
AVAX Price Prediction: Retracement Before Breakout?
The daily timeframe technical analysis gives a bearish AVAX price reading in the short term. This is because of the price action and the RSI.
The daily RSI has generated a bearish divergence (green). This occurs when a momentum decrease accompanies a price increase. It often leads to downward movements.
The price action shows a deviation above the $21.50 horizontal resistance area (red circle). These deviations are often followed by significant downward movements.
If that occurs, the AVAX price can fall by 30% to the 0.618 Fib retracement support level at $14.80.
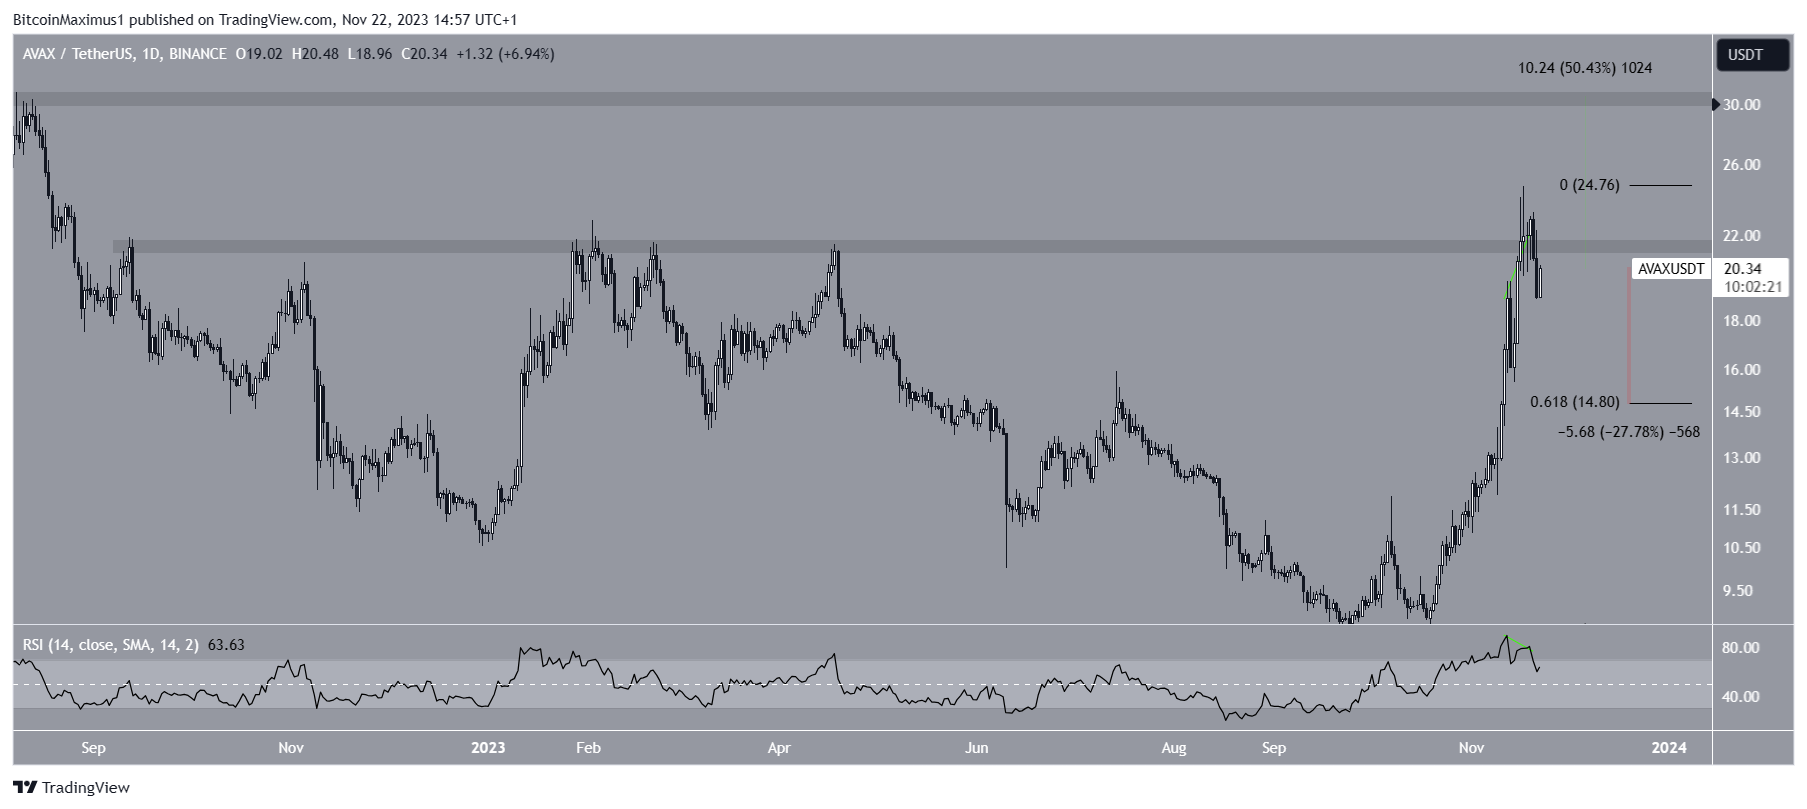
Despite this bearish AVAX price prediction, a close above the $21.50 resistance area can lead to a 50% increase to the next closest resistance at $30.
For BeInCrypto’s latest crypto market analysis, click here.