Ripple surged higher recently above the $0.2650 and $0.2720 resistances against the US Dollar. XRP price remains well supported and it could soon rally to $0.3000 if it breaks $0.2810.
- Ripple price rallied to a new 2020 high at $0.2811 and it is consolidating gains against the US dollar.
- The price remains well supported on the downside near the $0.2730 and $0.2700 levels.
- There is a key contracting triangle forming with resistance near $0.2788 on the hourly chart of the XRP/USD pair (data source from Kraken).
- The pair is likely to start a sharp rally towards $0.3000 once it breaks the $0.2810 resistance area.
Ripple Price Rally Could Gain Pace
In the past few sessions, there were strong gains in ripple above the $0.2650 resistance. XRP price even broke the $0.2720 and $0.2750 resistance levels.
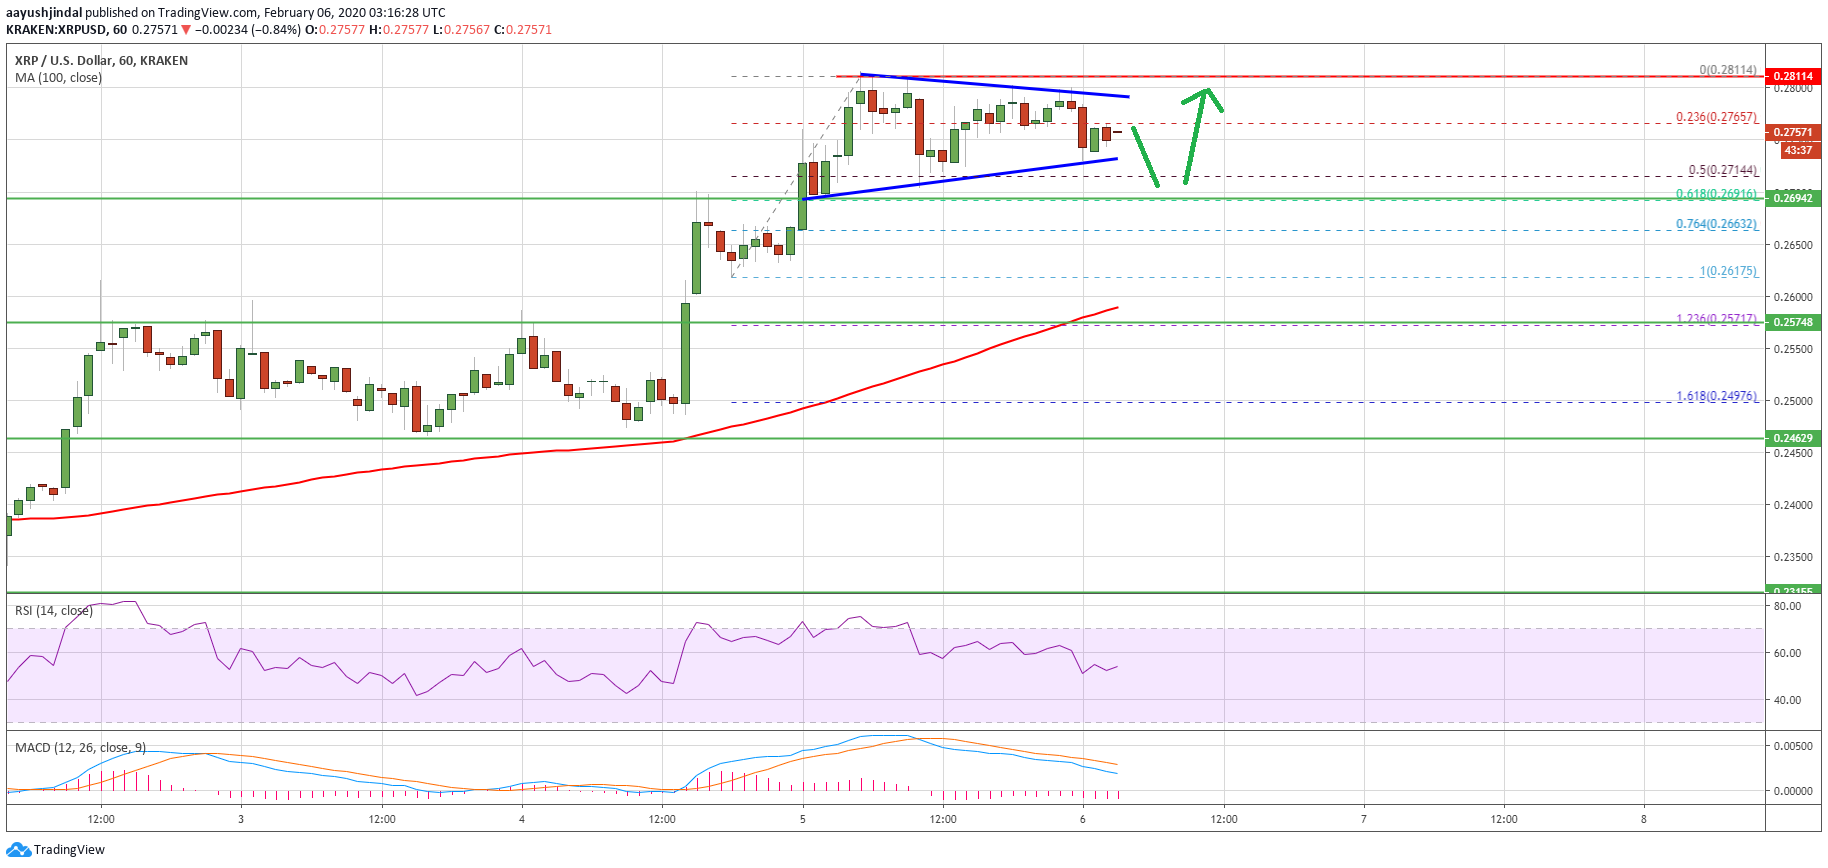
Finally, there was a break above the $0.2800 level and the price settled nicely above the 100 hourly simple moving average. A new 2020 high is formed near $0.2811 and the price is currently consolidating gains.
There was a break below the 23.6% Fib retracement level of the recent wave from the $0.2617 low to $0.2811 high. However, the price is finding strong bids above the $0.2720 and $0.2710 levels.
Moreover, there is a key contracting triangle forming with resistance near $0.2788 on the hourly chart of the XRP/USD pair. If the price continues to consolidate, there are high chances of an upside break above the triangle resistance and $0.2800.
Ripple Price
Ripple bulls need to gain pace above the $0.2810 resistance area to set the pace for a larger rally. In the mentioned case, the price is likely to surge towards the $0.2880 and $0.2920 levels. The next major hurdle for the bulls is near the $0.3000 handle.
Bulls Remain in Action
On the downside, there are many supports near the $0.2700 area. Besides, the 50% Fib retracement level of the recent wave from the $0.2617 low to $0.2811 high is at $0.2714.
Any further losses may perhaps push the price towards the $0.2695 support area. If ripple fails to stay above the $0.2695 support, it could extend its decline below $0.2680. In the mentioned case, the price might continue to decline towards the $0.2600 area or the 100 hourly SMA.
Technical Indicators
Hourly MACD – The MACD for XRP/USD is likely to move back into the bullish zone.
Hourly RSI (Relative Strength Index) – The RSI for XRP/USD is currently rising and it could soon clear the 60 level.
Major Support Levels – $0.2715, $0.2695 and $0.2620.
Major Resistance Levels – $0.2800, $0.2810 and $0.2880.