The feeling from many traders and investors in the past few days in the market has been that the price of Bitcoin is most likely to retest the region of $34,000 as the price of Bitcoin continues in its range of price movement within the region of $36,800 to $35,900.
The current price action for Bitcoin hasn’t been favorable for many altcoins as this has affected their price action, considering Bitcoin is the number one asset by market capitalization. It has much effect on the price action of many altcoins.
Despite the uncertainty of Bitcoin’s price action, there have been some weekly top 5 cryptos (XRP, RUNE, TIA, RNDR, DOGE) that have remained as top-performing altcoins within the week, holding very well and could be on the move to outperform Bitcoin and other assets in the coming weeks.
The news of Bitcoin spot ETF (Bitcoin spot Exchange-traded fund) continues to make many waves in the cryptocurrency market. It has been a great catalyst for the current Bitcoin rally, as many traders and investors believe it’s only a matter of time before its official approval.
Bitcoin spot ETF approval would remain a big catalyst for Bitcoin’s price considering its wide acceptance in the United States. It’s approval by the US SEC (United States Security and Exchange Commission) would be a good step in the right direction for many investors looking to leverage Bitcoin.
Every passing day makes the possibility of a Bitcoin spot ETF coming to the US a reality. This has sparked an increase in transactions on the network as Bitcoin transaction activities outperform Ethereum for the first time in 3 years, suggesting bullish activities for Bitcoin.
Ethereum has always outperformed Bitcoin with so many activities on its network, such as DeFi (Decentralized finance), NFTs (Non-fungible token), gaming, and the metaverse, all contributing to so much growth for Ethereum.
This growth in Bitcoin’s bullish price movement can be seen in its price in the past weeks and months ahead of its anticipated Bitcoin halving in less than seven months.
Despite experiencing a sharp price decline some days back across the market, the price of Bitcoin and other weekly top 5 cryptos (XRP, RUNE, TIA, RNDR, DOGE) continues to show much strength, rallying to new highs as there is room for many traders and investors to leverage on these top-performing altcoins.
The cryptocurrency heat map gives us a glimpse of how the market has been performing for the past few days, as there is high expectation in the cryptocurrency market leading up to the impending Bitcoin halving and the expected Bitcoin spot ETF.
Although the euphoria is welcomed considering how tough the cryptocurrency market has been for traders and investors for the past few years, a new dawn could be fast approaching with many opportunities for most weekly top 5 cryptos (XRP, RUNE, TIA, RNDR, DOGE).
The price of Bitcoin has had a rough time rallying past $38,000, acting as a strong resistance for the price as the price has faced rejection around $37,800 as bear tries to push the price of Bitcoin lower.
Bitcoin’s bulls struggling to push the price to a high of $38,000 and possibly $40,000 has led to price ranging in an uptrend channel as there has been speculation of price breaking lower to a region of $34,000 to $33,000 where bulls could push the price of Bitcoin higher.
The price of Bitcoin currently trades above its 50-day, 100-day, and 200-day Exponential Moving Averages (50-day, 100-day, and 200-day EMAs), respectively, on both the daily and weekly timeframes, suggesting bullish price action for Bitcoin.
If the price of Bitcoin fails to break above $38,000, then the price retesting the lows of $34,000 would be a good start for bulls to push prices higher and investors to accumulate more Bitcoin longs.
A minor retracement for the price would be healthy and welcomed as the overall price action on the higher timeframe all point to Bitcoin remaining bullish heading into a new week and months to come.
The price action of Ethereum has remained under the shadows of Bitcoin, which is unusual considering how it has outperformed Bitcoin for years now as the price of Ethereum struggles to maintain a bullish price action above $2,000.
Even though Ethereum has remained less interesting for this period, many altcoins, including the weekly top 5 cryptos (XRP, RUNE, TIA, RNDR, DOGE), are all on a rampage from their respective lows as the new week presents endless opportunities for traders and investors.
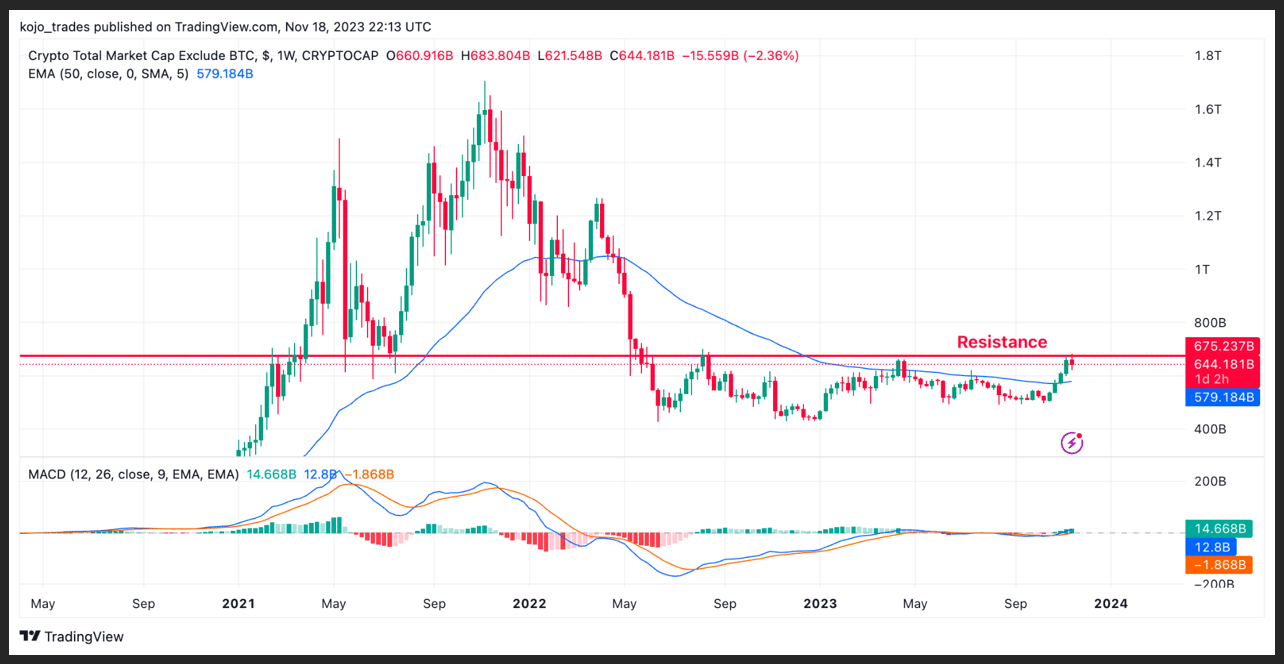
Despite the altcoin market looking favourable for the past few weeks, on-chain data shows the altcoin market faces critical decision time as the total altcoin market capitalization faces key resistance above the 50-day EMA at a region of 680 Billion Market Cap, and the price needs to break above this region.
If the price of altcoin market cap breaks above this key resistance at around 680 Billion market cap, we could see the price of altcoins and their market cap rally with so much bullish price action for the first time in 2 years in the last bear market that has affected the price of all assets.
With so much anticipation for altcoins, let’s look at some weekly top 5 cryptos (XRP, RUNE, TIA, RNDR, DOGE) and how they will perform in the next few days or weeks to come as the market remains favourable for all.
Ripple (XRP) Price Action Chart Analysis as a Weekly Top 5 Crypto to Watch
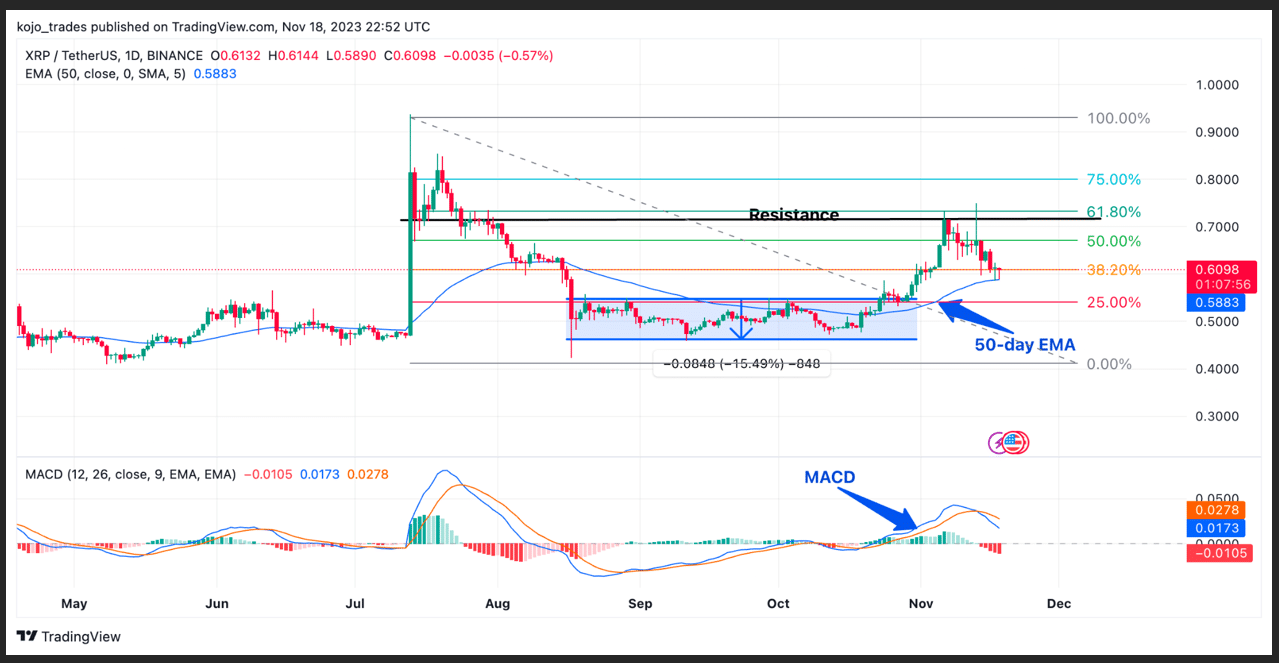
It was a spectacle seeing the price of Ripple (XRP/USDT) breaking out of its range price movement after the bear market affected its price negatively, coupled with its controversial case with the US SEC.
The case with the US SEC has seen its price drop from it’s all-time high of $3.5 to a low of $0.4 as the price bounced from this region to its price range of $0.45 to $0.5 as Ripple’s (XRP) attempt to break above was cut short by bears.
The news of XRP winning its lawsuit was a big positive for the community, and the price of XRP/USDT rallied from its low to a high of $0.93 before its price rejection from its yearly high to a region of $0.5.
After several weeks of price ranging between $0.45 to $0.55, the price of XRP/USDT broke out from its range with a close above $0.6 as the price of XRP/USDT rallied to $0.73, where it faced a key resistance.
The price of XRP/USDT dropped to a region of $0.6, just above the 50-day EMA and 38.2% Fibonacci Retracement value (38.2% FIB value) acting as support for the price of XRP/USDT on the daily timeframe.
Ripple’s price saw a shart price bounce to a high of $0.72 after fake news broke out of Ripple’s ETF application by Blackrock as the price fell to a low of $0.6 after it was confirmed fake.
On-chain data and analysts suggest XRP/USDT could be a sleeping giant in the next bull run, considering its increased activities with price lagging behind other altcoins.
The price of XRP/USDT needs to hold above its current support of $0.6 to avoid price entering into its long-range price movement. If XRP/USDT holds above this region, we could see the price attempt a break above $0.73 and a possible recapture of $0.8 to a high of $1.
Ripple’s Moving Average Convergence Divergence (MACD) and its Relative Price Index (RSI) suggest bears could push prices lower if bulls fail to depend on the current support region of XRP/USDT.
Major XRP/USDT support zone – $0.6
Major XRP/USDT resistance zone – $0.75
MACD trend – Bearish
ThorChain (RUNE) Daily Price Chart as a Top 5 Crypto Asset
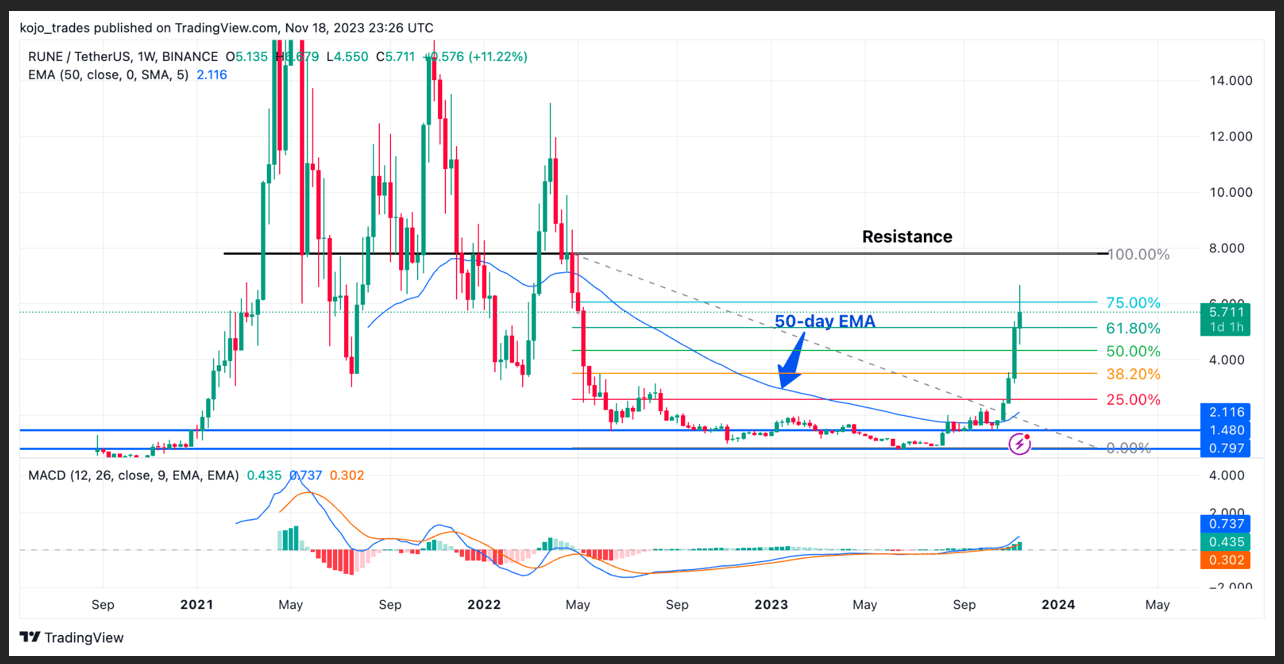
ThorChain has been a revelation in 2023 despite the bear market affecting the price of many cryptocurrency assets as the price has grown from a region of $0.8 to a high of $6.6, a new yearly high with over 500% price rally.
On-chain data has shown that ThorChain has recorded high trading volume among many DEX (decentralized exchanges) as users have been attracted to its high yield, all thanks to its ThorSwap DEX used to convert Bitcoin to Ethereum on the ThorChain network.
With such activities on the ThorChain network, it has rallied past Curve finance DeFi activities as these on-chain activities have positively influenced the price of RUNE/USDT in the past 30 days.
The price of RUNE/USDT rallied from a low of $1.5 to a yearly high of $6.6 as bulls remained dominant in price, which increased activities going on on the ThorChain protocol. If the activities continue to earn yield in the form of RUNE, we could see the price of RUNE/USDT breaking the resistance at $8.
If the price of RUNE breaks and closes above $8, we could see the price rally to a high of $14, creating a new yearly high as RUNE/USDT currently faces a minor price rejection.
The support is around $5, just above the 61.8% FIB value, and trading above the 50-day EMA would be a good area for bulls to open longs as a break, and closing below this region would be tough for bulls.
The MACD and RSI for RUNE/USDT indicate bullish price action for RUNE/USDT as the price would continue to perform well leading up to the bull run.
Major RUNE/USDT support zone – $5
Major RUNE/USDT resistance zone – $8
MACD trend – Bullish
Dogecoin (DOGE) Price Analysis on the Daily Timeframe
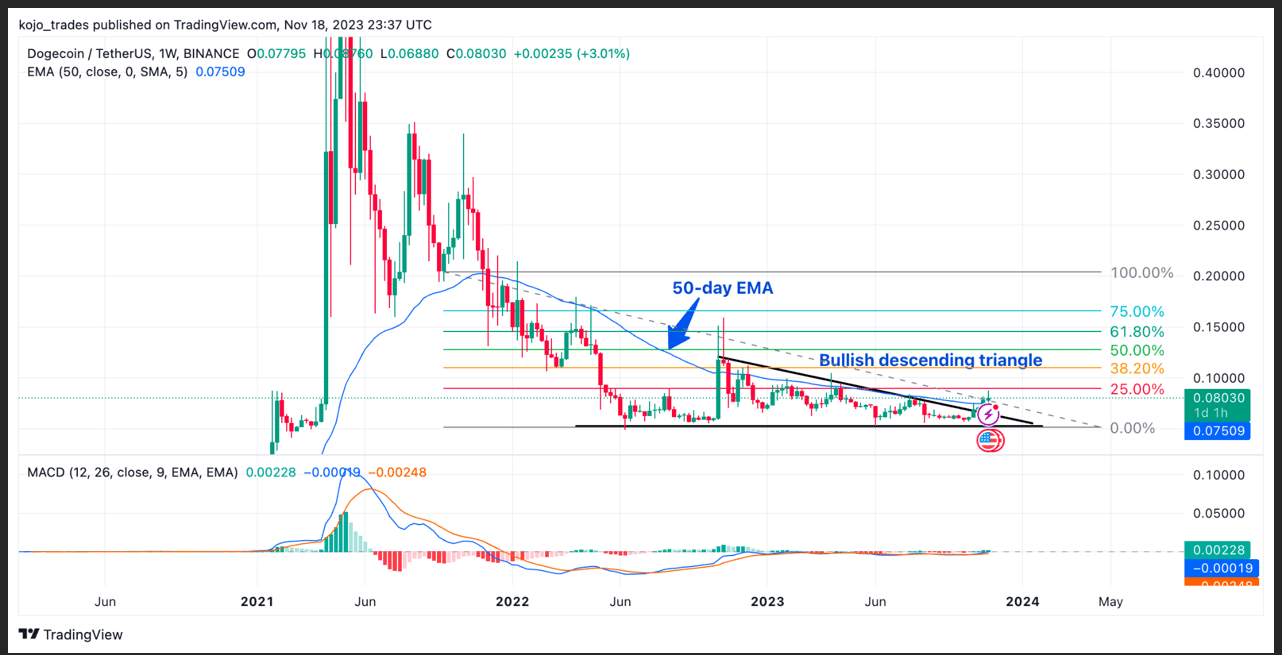
The cryptocurrency memecoin king Dogecoin (DOGE) still needs to protect its price DOGE/USDT above the key region of $0.085 as the price continues to battle off bears to trend higher to a high of $0.15.
Despite forming a bullish descending triangle and trading above the 50-day EMA acting as support for the price of DOGE/USDT. The price of DOGE/USDT needs to hold its price above this region to avoid price dropping lower to its range-bound area.
If the price of DOGE/USDT needs to reclaim its bullish price action, the price of DOGE/USDT needs to break above the 25% FIB value to its 38.2% FIB area. If the price of DOGE/USDT breaks above $0.1, we would see much FOMO pushing the price of DOGE higher.
The current price action for DOGE remains as mixed feelings for traders and investors as the price of DOGE/USDT struggles to reclaim the above key area of interest for many traders.
Dogecoin’s MACD and RSI indicate less price action for DOGE/USDT as buy volume for the assets hasn’t been encouraging for the past few weeks.
Major DOGE/USDT support zone – $0.065
Major DOGE/USDT resistance zone – $0.15
MACD trend – Neutral
Render Token (RNDR) Price Analysis as a Top Crypto Asset
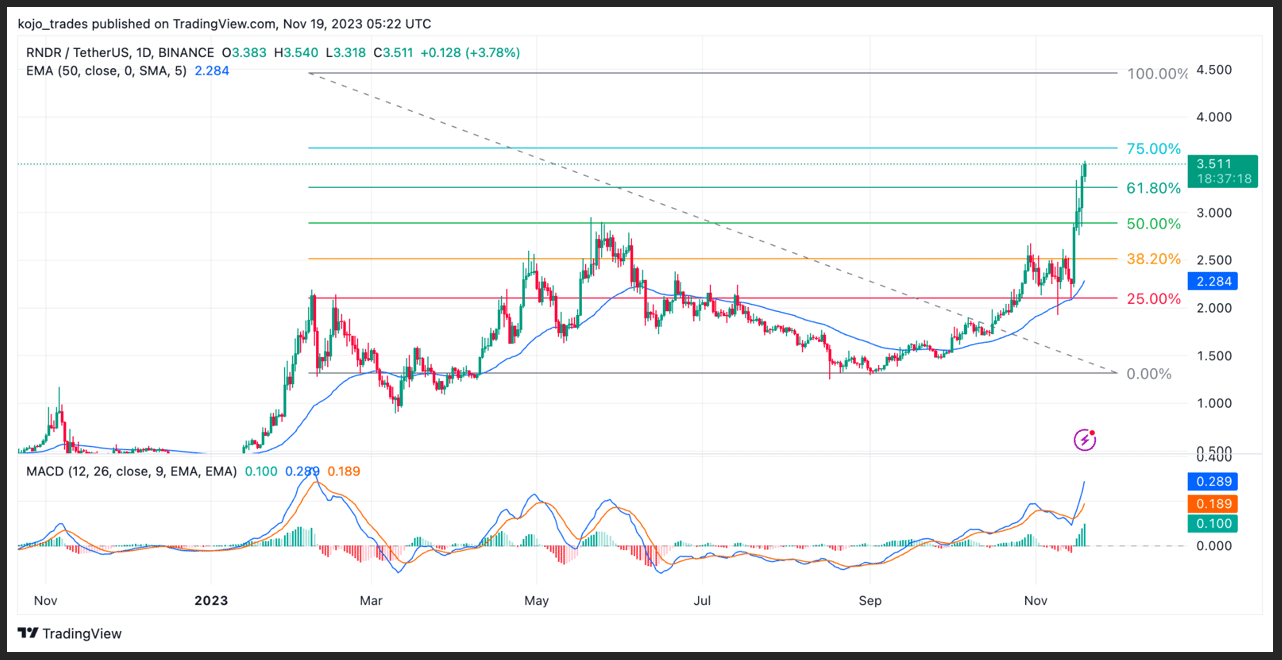
The hype surrounding the artificial intelligence (AI) token continues to make rounds in the cryptocurrency market, with the likes of Render Token and Fetch.AI taking the lead in the rally as this crypto token is not looking like slowing down for a bit.
Render Token has remained one of the top-performing AI tokens of 2023, rallying from its low of $0.5 to a high of $2 before facing resistance to trend higher. Bears rejected the price to a region of $1.3, where the price struggled to regain bullish price action.
The price of RNDR/USDT reclaimed its price action above the 50-day EMA, suggesting a change in trend from bearish to bullish, with the MACD and RSI all flipping bullish in favour of RNDR/USDT as the price aims for new highs.
RNDR/USDT will continue to make new highs after a successful breakout above the 50% FIB value with strong price action as the AI hype could be back in crypto to rally its price higher.
Major RNDR/USDT support zone – $2.9
Major RNDR/USDT resistance zone – $5
MACD trend – Bullish
Celestia (TIA) Price Analysis as a Weekly Top 5 Crypto Asset
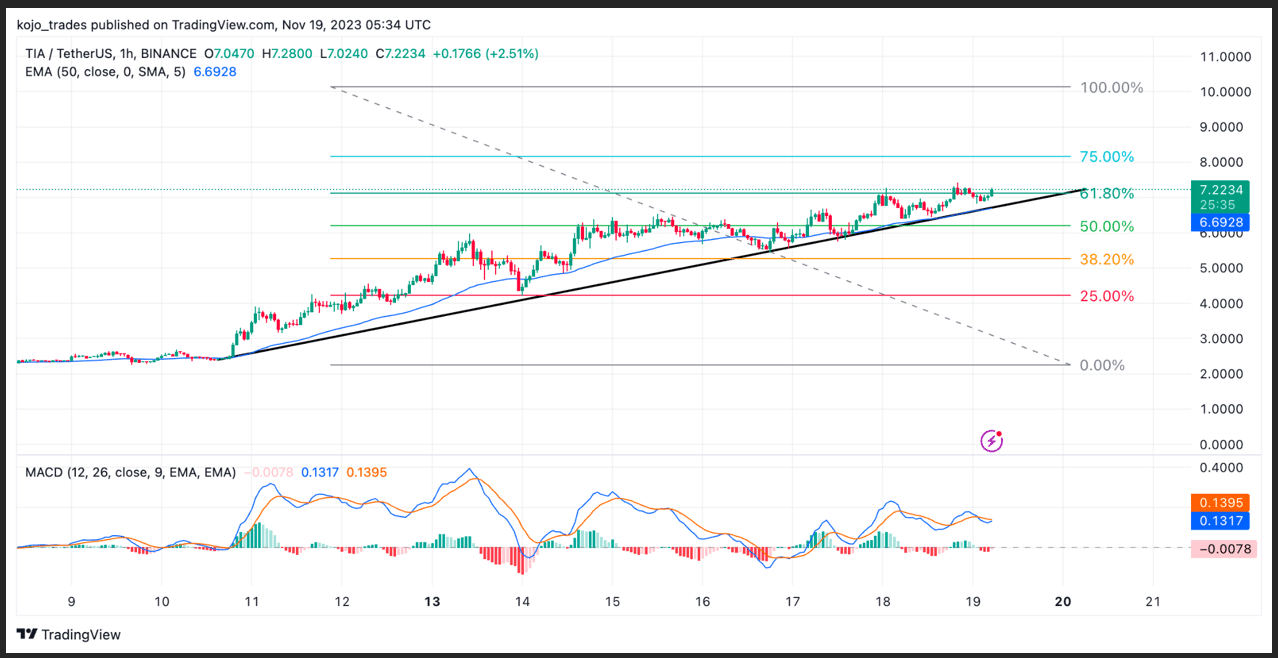
Celestia, a newly launched modular blockchain, continues to make so much hype among traders and investors as the price of the assets has had over 300% in less than a month as many believe this is the next Solana Killer with so much use case.
Despite being the new kid in the block, the price of TIA/USDT has been something to keep an eye on as this could be the new gem of the next crypto bull market as traders and investors continue to monitor its price action.
After its launch, around $2, the price of TIA/USDT had a slow start as price ranged within the region of $2 before showing bullish price action as bulls continued to dominate the price to a high of $7.2.
The price action for TIA/USDT remains very strong as its MACD and RSI are all bullish on its price. The price of TIA/USDT trades above the 50-day EMA and 61.8% FIB value, which is good for more bullish action as the price targets $10.
Major TIA/USDT support zone – $6
Major TIA/USDT resistance zone – $10
MACD trend – Bullish
 thecryptobasic.com
