Markets are on minor bull activity today, with the global market cap sitting 0.27% above its previous 24-hour mark, as the total cap stands at $1.4T as of press time. The fear and greed index is at 71, as greed still dominates. The global trading volume is 8% up in 24 hours, at $67.4B as of press time.
Bitcoin price analysis
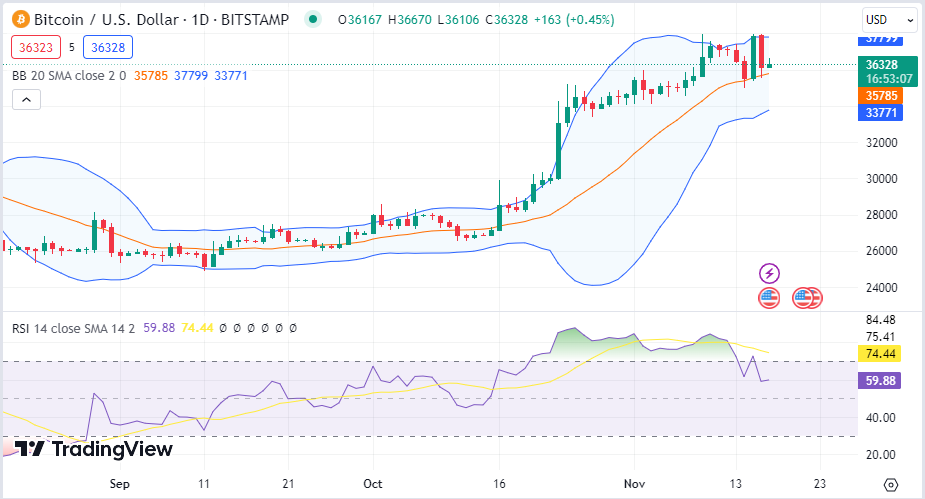
However, Bitcoin ($BTC) has started on bear activity, as Bitcoin price stood at $36.3K as of press time after recording a daily decrease of 3.4% and a weekly drop of 0.93%. As a result of the Bitcoin price, the token’s trade volume dropped by 8% during the same period and is presently at $26.1B.
The Bollinger bands are converging, showing dropping volatility levels on Bitcoin Price. The Relative Strength Index (RSI) is below the average line, showing bear dominance on Bitcoin price.
Ethereum price analysis
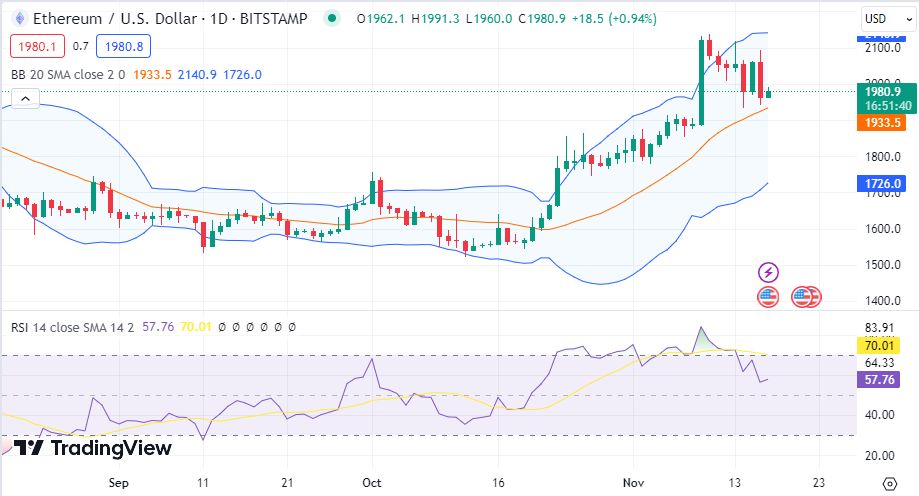
Ethereum ($ETH) has also started on bear activity, as Ethereum price stood at $1981 after recording a daily decrease of 4%, as the weekly rise now stands at 6%. $ETH’s trade volume jumped by 6% during the same period, presently at $14.5B.
The Bollinger bands are far apart, showing high volatility levels on Ethereum Price as the Relative Strength Index (RSI) is below the average, showing bear dominance on Ethereum price.
Dogecoin price analysis
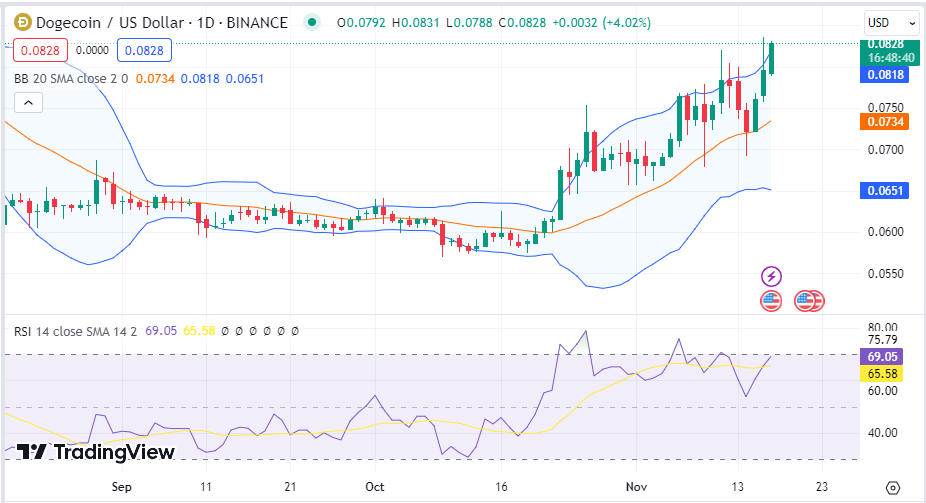
Dogecoin ($DOGE) has started on bull activity, as Dogecoin price stood at $0.0824 after recording a daily increase of 7%, as the weekly rise now stands at 10%. $DOGE’s trade volume jumped by 240% during the same period, presently at $1.8B.
The Bollinger bands are diverging, showing high volatility levels on Dogecoin Price as the Relative Strength Index (RSI) is above the average close to the overbought region, showing bull dominance on Dogecoin price.
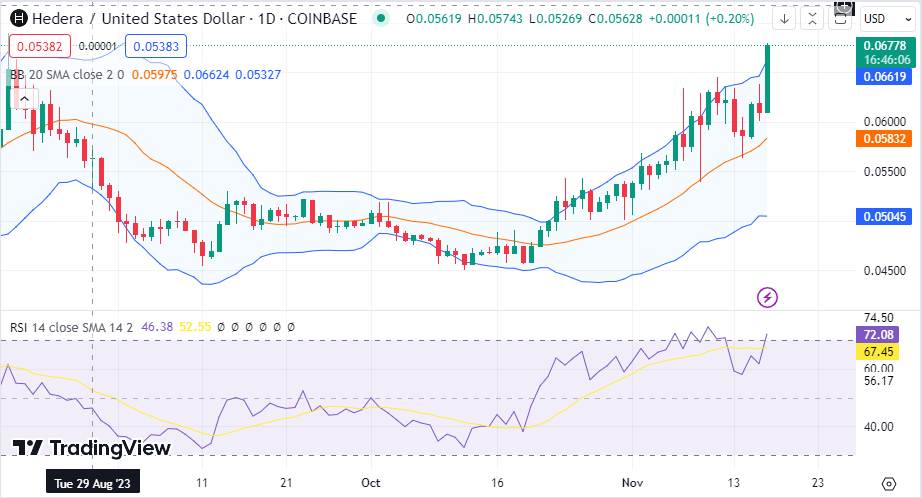
Hedera price analysis
Hedera ($HBAR) has also started on bull activity, as Hedera price stood at $0.067 after recording a daily increase of 6.9%, as the weekly rise now stands at 12%. $HBAR’s trade volume jumped by 44% during the same period, presently at $113M.
The Bollinger bands are diverging, showing high volatility levels on Hedera Price as the Relative Strength Index (RSI) is above the average in the overbought region, showing bull dominance on Hedera price.
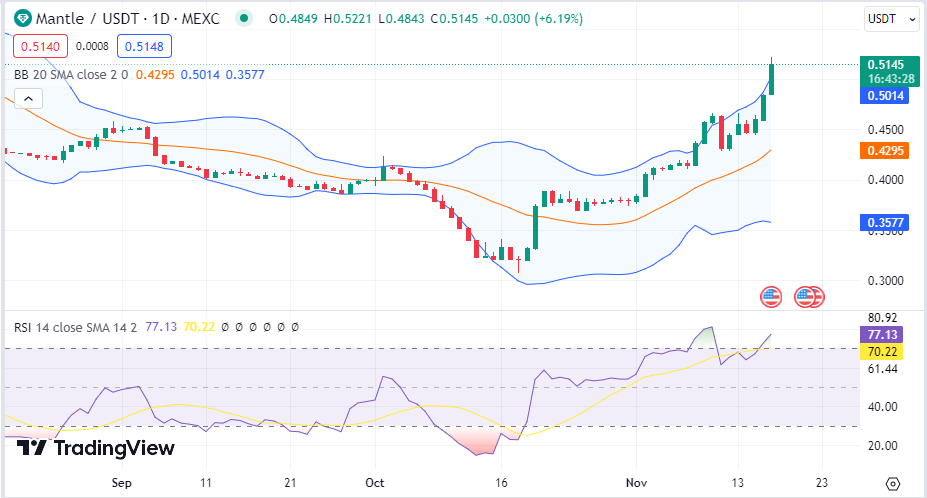
Mantle price analysis
Mantle ($MNT) has also started on bull activity, as Mantle price stood at $0.5169 after recording a daily increase of 10.8%, as the weekly rise now stands at 12.3%. $MNT’s trade volume jumped by 79% during the same period, presently at $138M.
The Bollinger bands are diverging, showing high volatility levels on Mantle Price as the Relative Strength Index (RSI) is above the average in the overbought region, showing bull dominance on Mantle price.