
The Litecoin ($LTC) price has increased since Oct. 19, breaking out from long- and short-term descending resistance trend line.
Despite the breakout, the price increase has stalled since Nov. 12. Will $LTC regain its footing and accelerate its increase?
Litecoin Reclaims Lost Long-Term Support
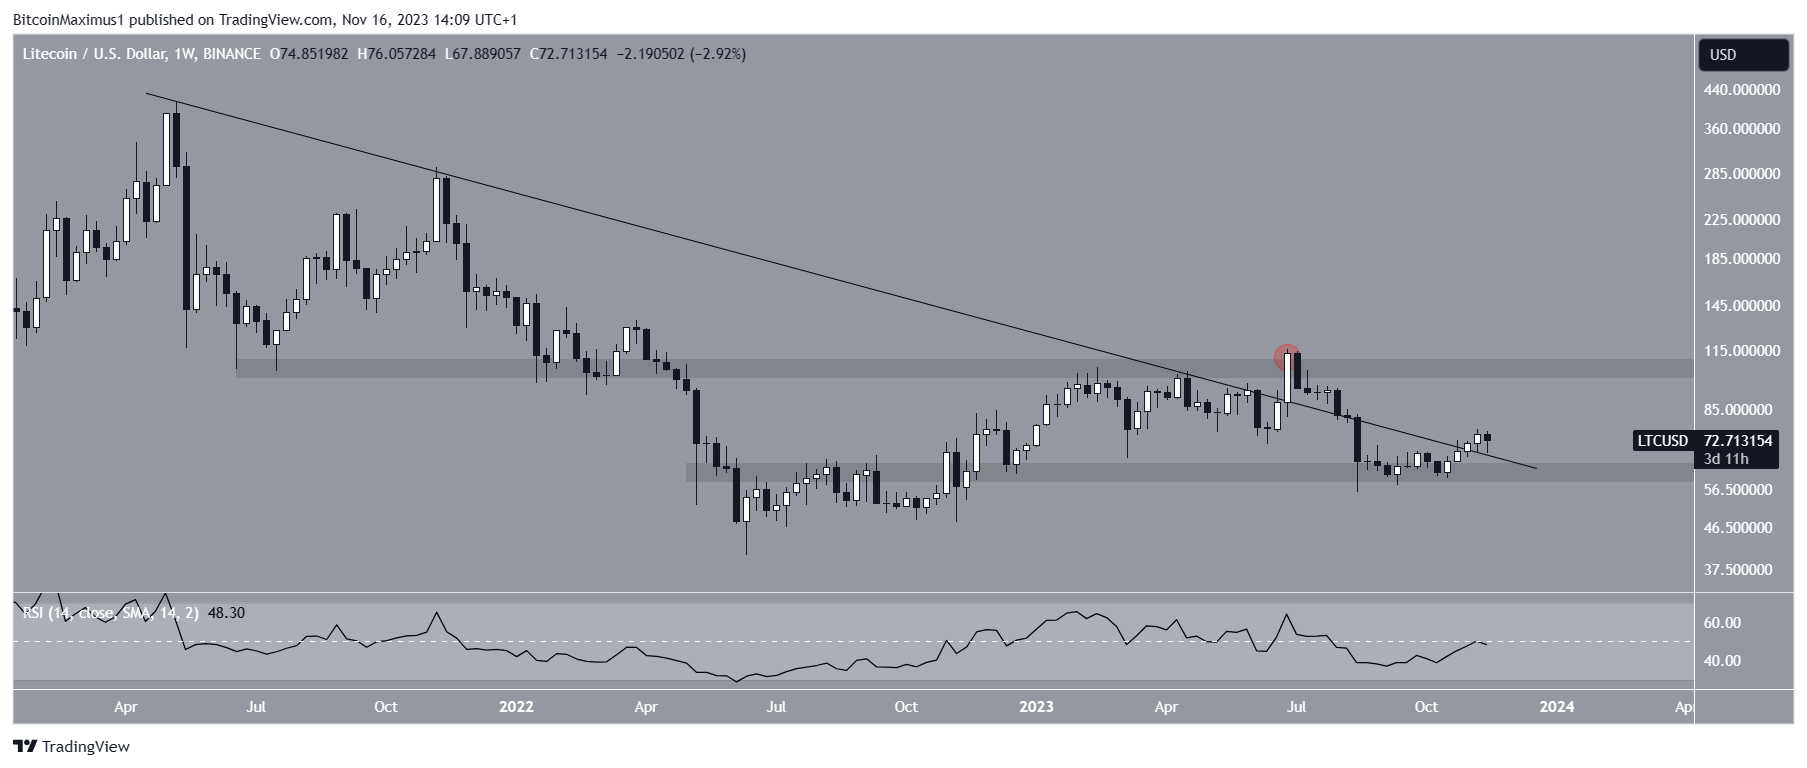
The weekly time frame technical analysis for $LTC shows that the price has fallen since June (red circle). The price had broken out from a long-term descending resistance trend line and the $105 horizontal resistance area at the time.
However, the ensuing drop invalidated the breakout. Rather, it suggested that the $LTC price upward movement was only a deviation.
The decrease led to a low of $56 in August, confirming the $60 area as long-term support.
Read more:7 Best Litecoin ($LTC) Wallets for 2023
The $LTC price has gradually increased since. It accelerated its rate of increase in October and broke out from the trend line last week. Litecoin is in the process of validating the trend line as support once more.
The Relative Strength Index (RSI) serves as a momentum indicator, enabling traders to assess if a market is overbought or oversold, aiding in decisions to buy or sell an asset.
Bulls hold an advantageous position when the RSI reading is above 50, and the trend is upward. Conversely, if the reading is below 50, the opposite holds.
The weekly RSI is increasing but below 50, a sign of an undetermined $LTC price trend.
Read more: How To Buy Litecoin ($LTC) in 4 Easy Steps
What Are Analysts Saying?
Cryptocurrency traders on X are mostly bullish for the future.
SantoXBT believes that the price will hit $150-$200 by the end of the year.
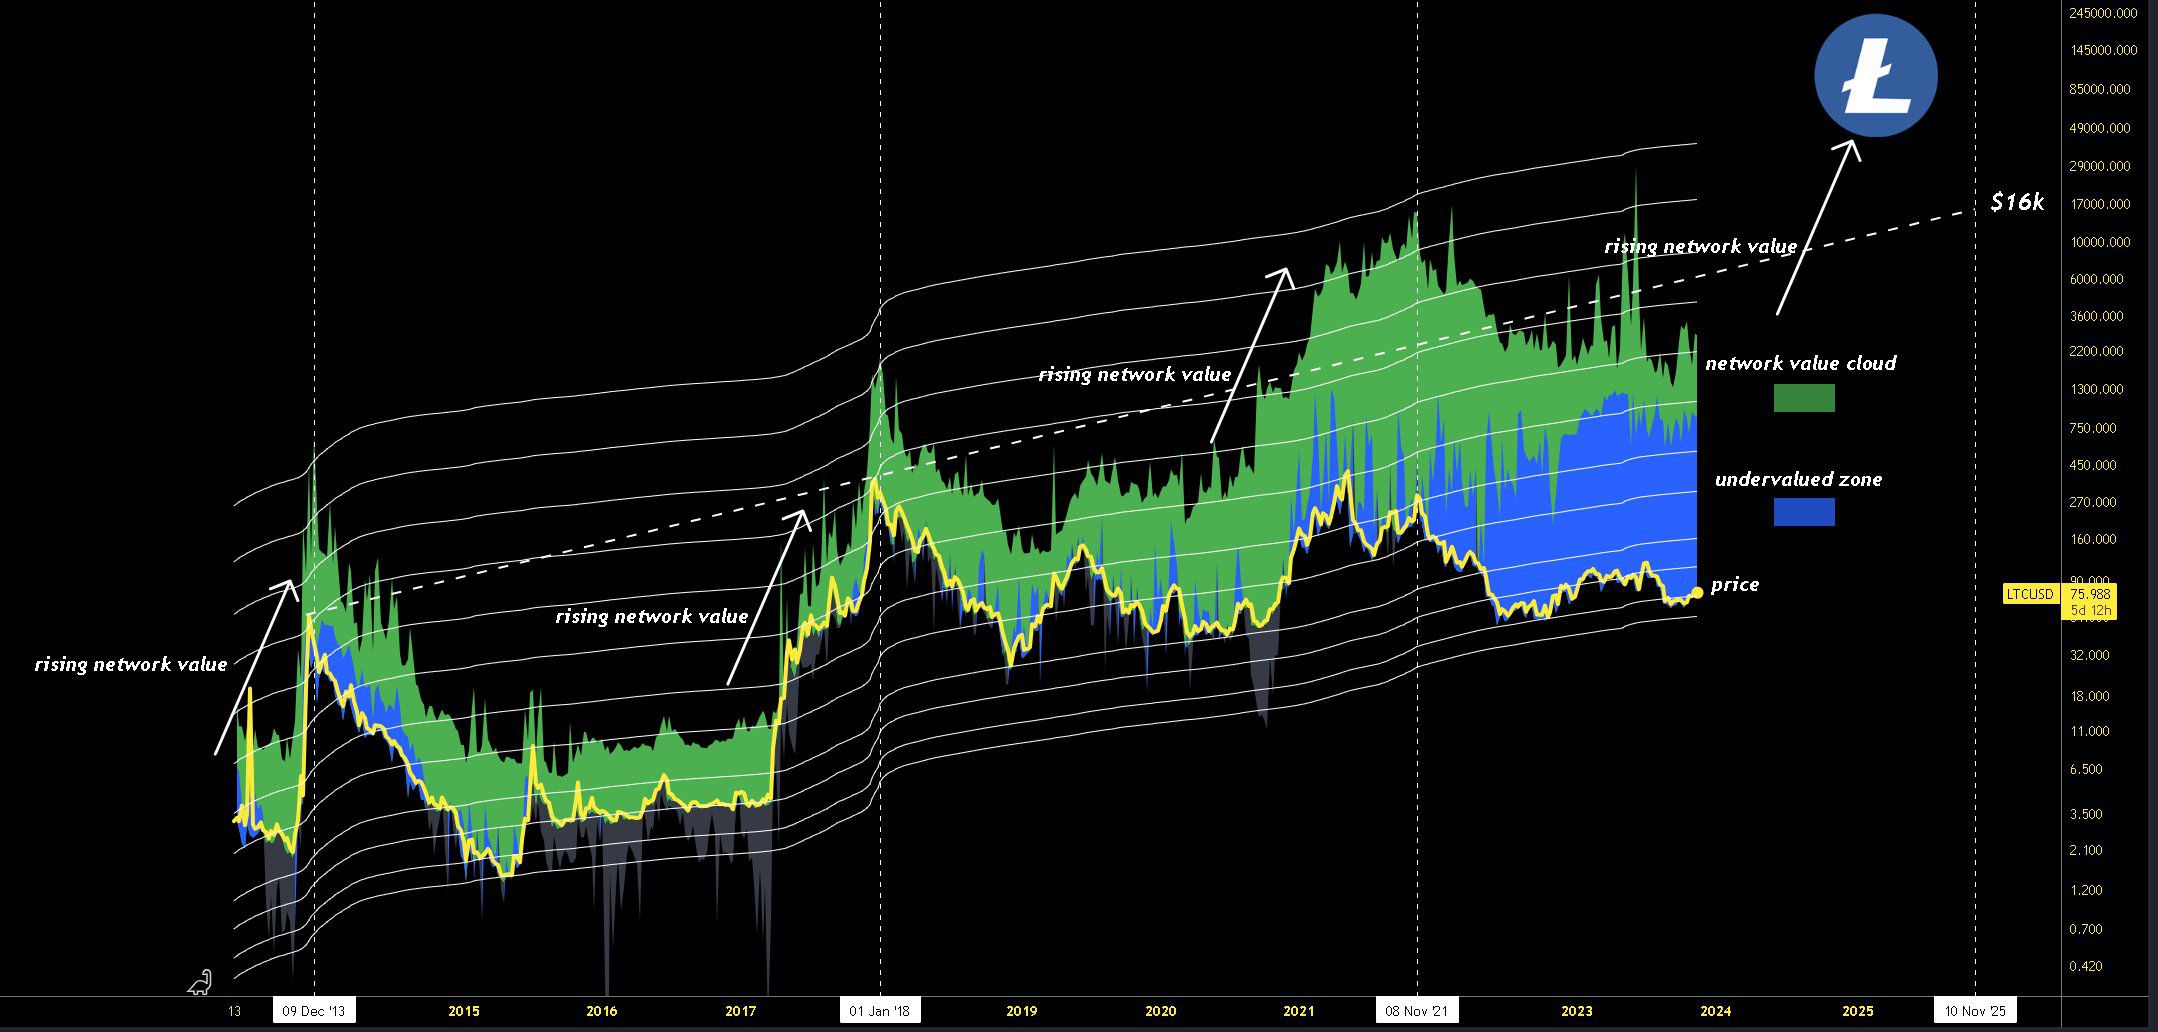
Shan Belew is also bullish about the future Litecoin trend because he believes that the network is undervalued. He stated that:
“Litecoin remains one of the best crypto networks for maximum potential in price compared to its network value. If the next Bitcoin cycle top is December 2025 there are 24 months remaining.”
ChrisOnCrypto agrees. He believes that $LTC is one of the most undervalued networks based on its fundamentals and could see explosive growth by the end of January.
$LTC Price Prediction: Can Price Maintain Its Breakout?
The daily time frame for $LTC is bullish, supporting the continuing of the long-term breakout.
There are several reasons for this:
Firstly, the $LTC price broke out from a short-term descending resistance trend line and reclaimed the $70 horizontal area. The area had previously provided resistance since August.
Secondly, the daily RSI has generated a hidden bullish divergence (green). This divergence is a sign of trend continuation and legitimizes the breakout.
If $LTC continues moving upwards, it can increase by another 30% and reach the 0.618 Fib retracement resistance level at $0.93.
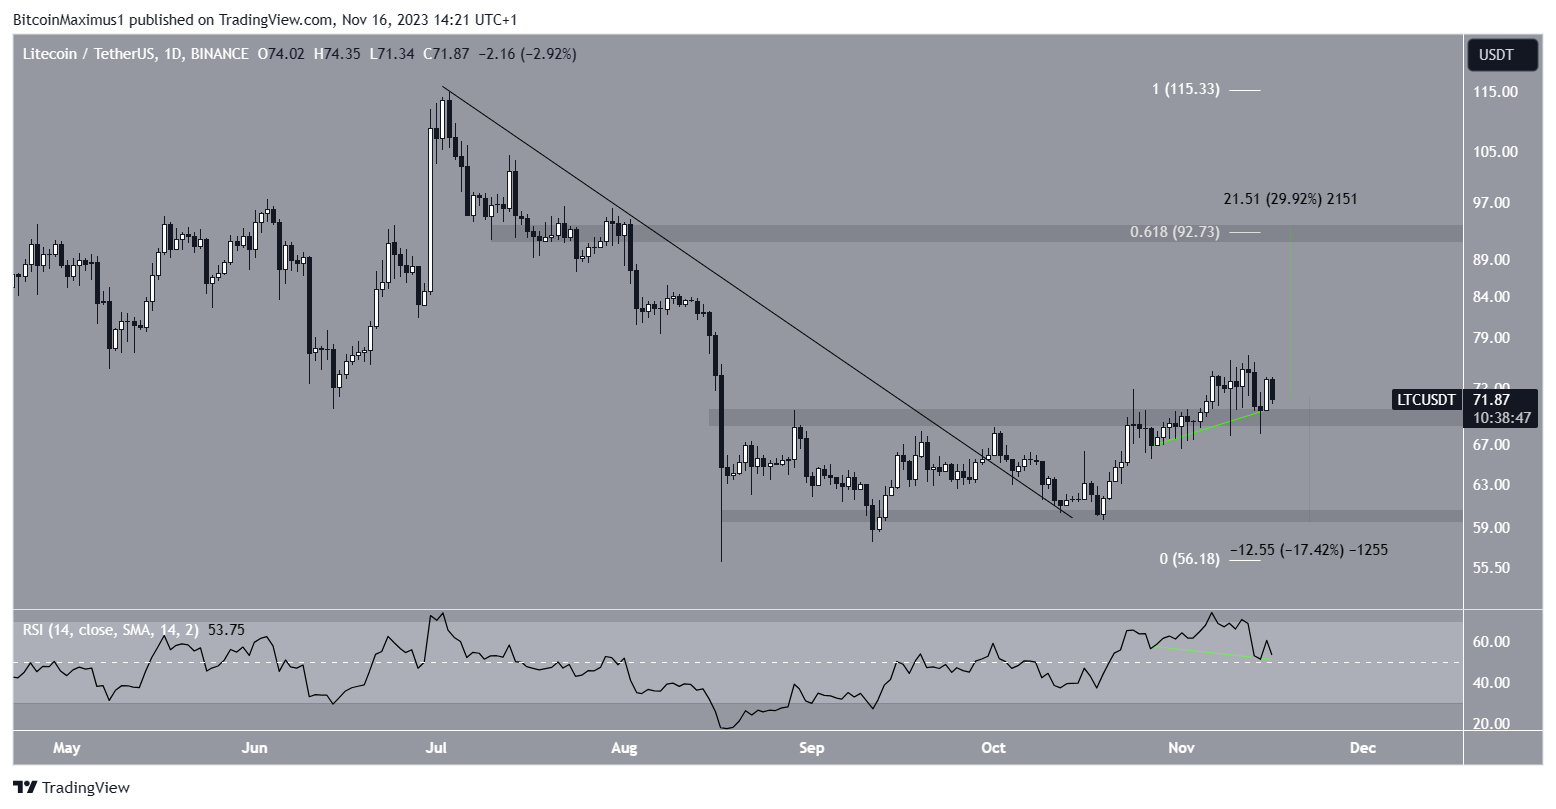
Despite this bullish $LTC price prediction, a close below the $70 horizontal support area can trigger a 17% drop to the closest support at $60.
For BeInCrypto’s latest crypto market analysis, click here.