The Dogecoin (DOGE) price has increased swiftly since Oct. 18, breaking out from long- and short-term descending resistance trend lines.
Despite the breakout, the price has yet to accelerate its rate of increase. Will it do so now?
Dogecoin Increases After Breakout From Long-Term Resistance
Dogecoin’s weekly timeframe technical analysis reveals that the price had fallen under a long-term descending resistance trend line since the all-time high of May 2021. The descent culminated with a low of $0.049 in June 2022.
Afterward, the DOGE price bounced but failed to break out from the resistance. The failed attempts created lower highs and long upper wicks (red icons), considered signs of selling pressure.
Read more: (DOGE) Dogecoin Price Prediction
Despite the failed breakout attempts, the DOGE price regained its footing again. It finally broke out from the trend line in November. At the time of the breakout, the trend line had been in place for more than 900 days.
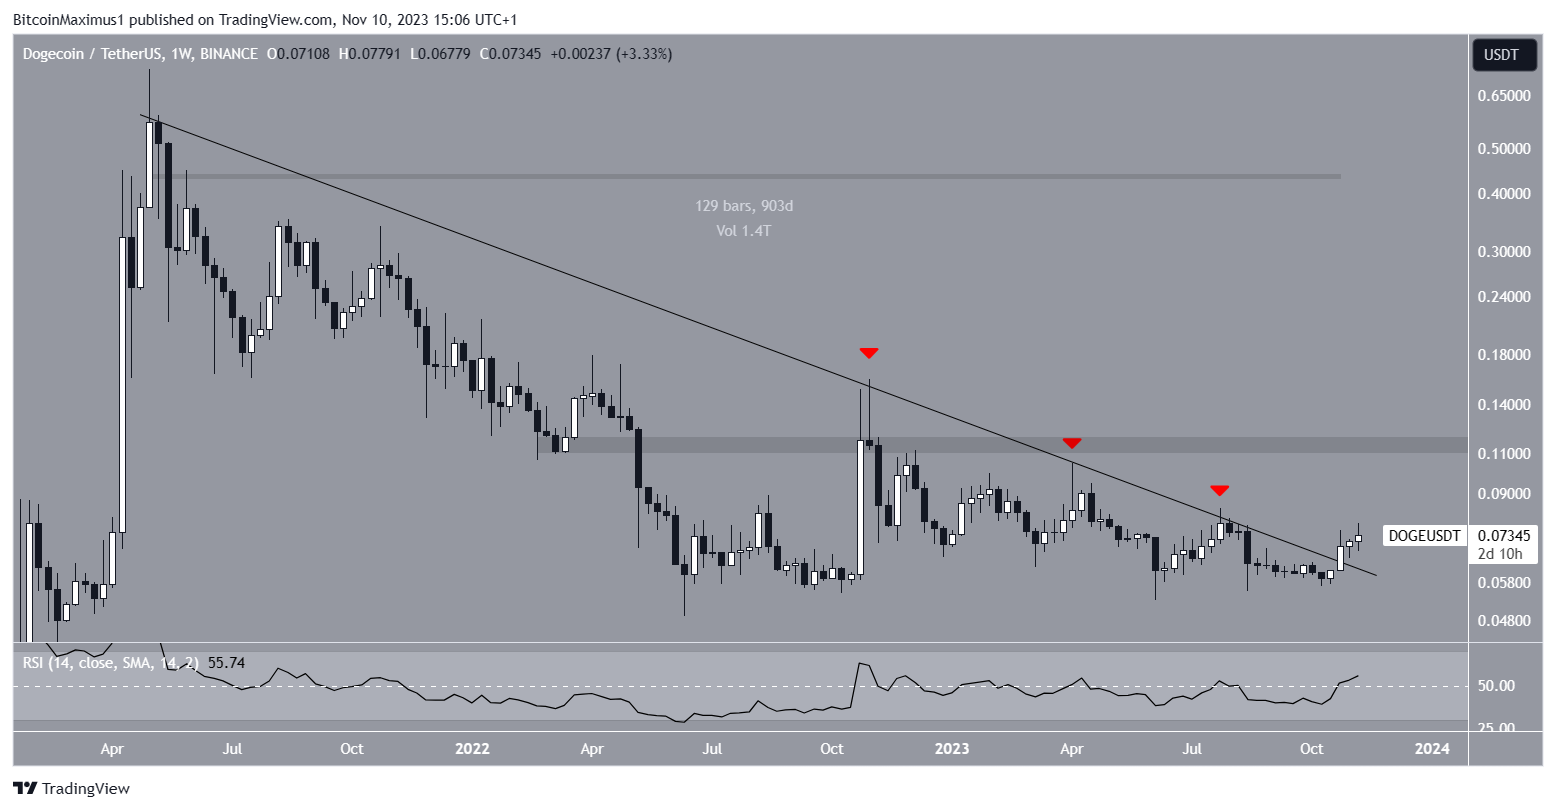
The weekly Relative Strength Index (RSI) does not confirm the trend’s direction.
With the RSI as a momentum indicator, traders can determine whether a market is overbought or oversold and decide whether to accumulate or sell an asset.
Bulls have an advantage if the RSI reading is above 50 and the trend is upward, but if the reading is below 50, the opposite is true.
While the RSI has moved above 50, it has not closed yet.
What Is Sentiment on X?
Cryptocurrency analysts on X are decisively bullish on the Dogecoin price.
Xnaeemmr tweeted a bullish cup and handle pattern, stating that the price will likely break out from it and increase significantly afterward.
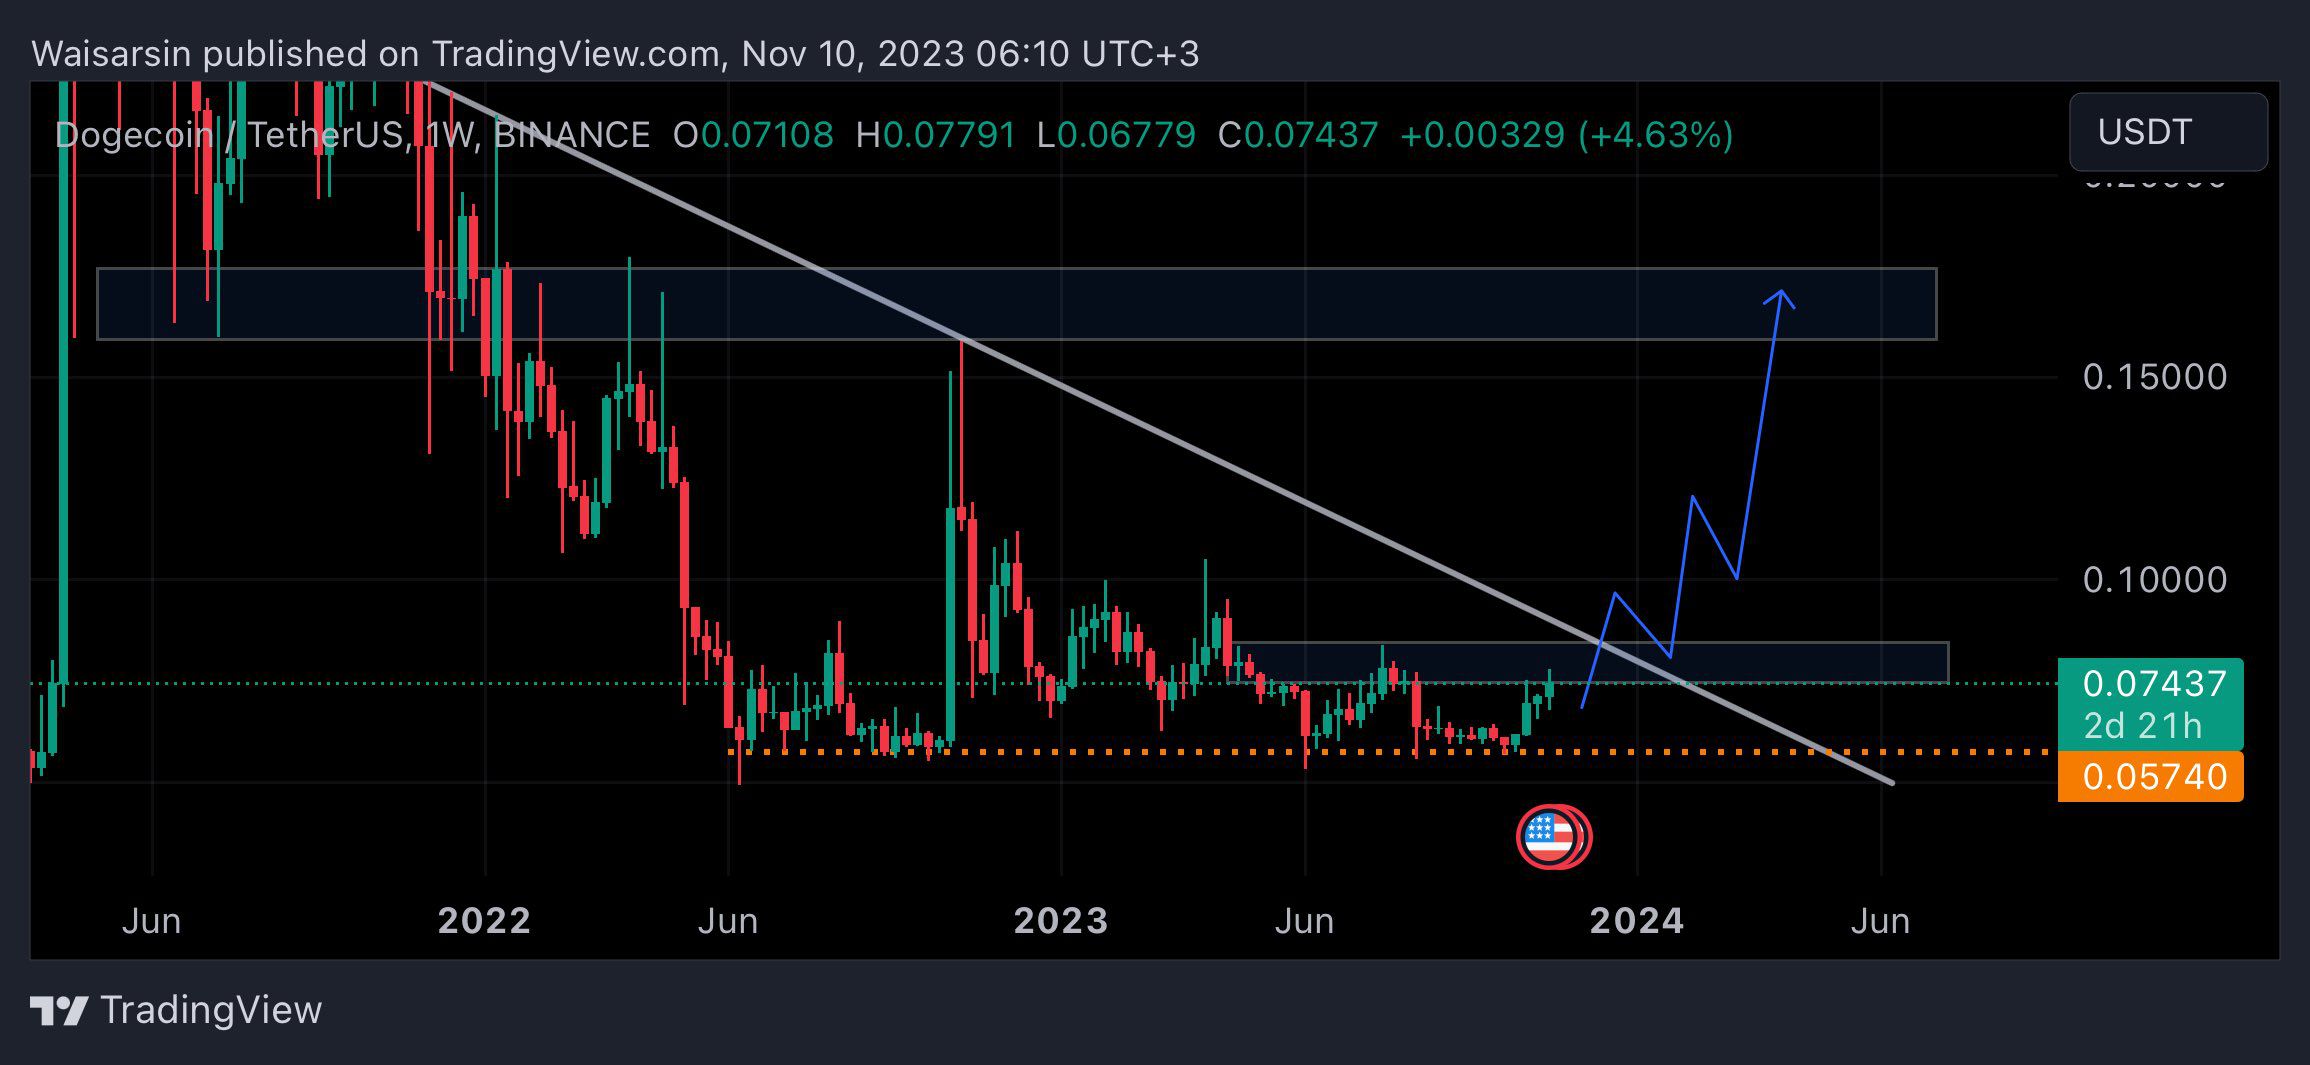
Wais_taherian is also bullish. However, he has drawn a less steep descending resistance trend line, from which DOGE has not broken out yet.
Therefore, he suggests waiting for a breakout and re-test before entering the trade.
Finally, CryptoKaleo used a fractal to suggest that the Dogecoin price increase will soon go parabolic.
Read more: How To Buy Dogecoin (DOGE) and Everything You Need To Know
DOGE Price Prediction: Start of a Reversal?
While the weekly time frame is decisively bullish, the daily one suggests that a retracement can occur before the price continues to increase. This is because of the daily RSI.
The daily RSI has generated a bearish divergence (green), a bearish occurrence where a momentum decrease accompanies a price increase. This often leads to downward movements, as was the case with DOGE yesterday.
If the DOGE price continues to fall, it can decrease by another 9% and reach the closest support at $0.067.
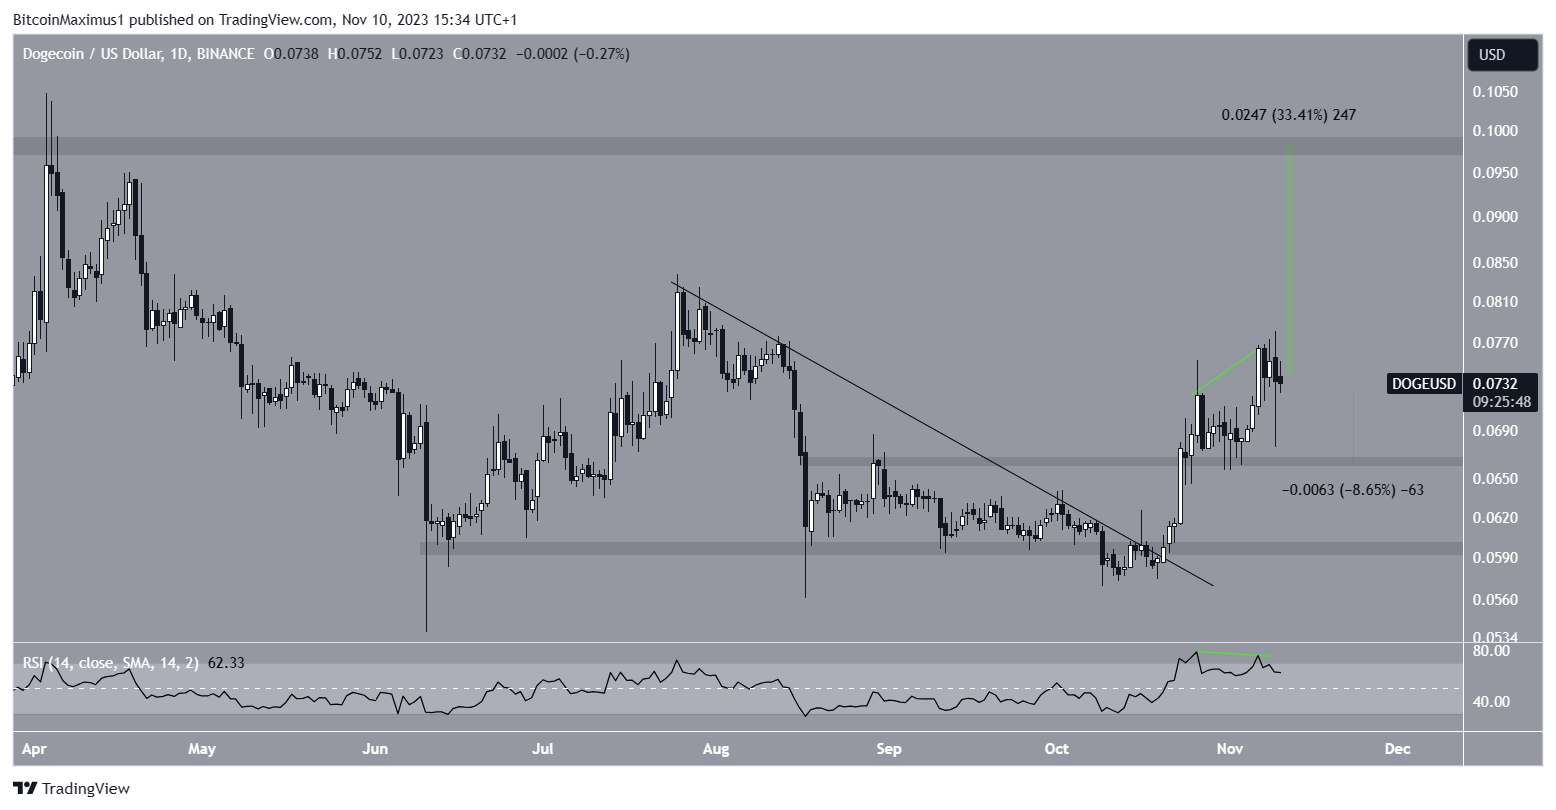
Despite this bearish DOGE price prediction, an increase above the November high of $0.078 will mean the correction is complete. In that case, a 30% increase to the next resistance at $0.100 will be expected.
Read More: Crypto Signals: What Are They and How to Use Them
For BeInCrypto’s latest crypto market analysis, click here.