October was a decisively bullish month for the cryptocurrency market, but these three bearish cryptos face a negative outlook for November.
Even though the Bitcoin (BTC) price and several altcoins reached new yearly highs, the worst is yet to come for these three cryptos.
Maker (MKR) Breaks Down From Long-Term Pattern
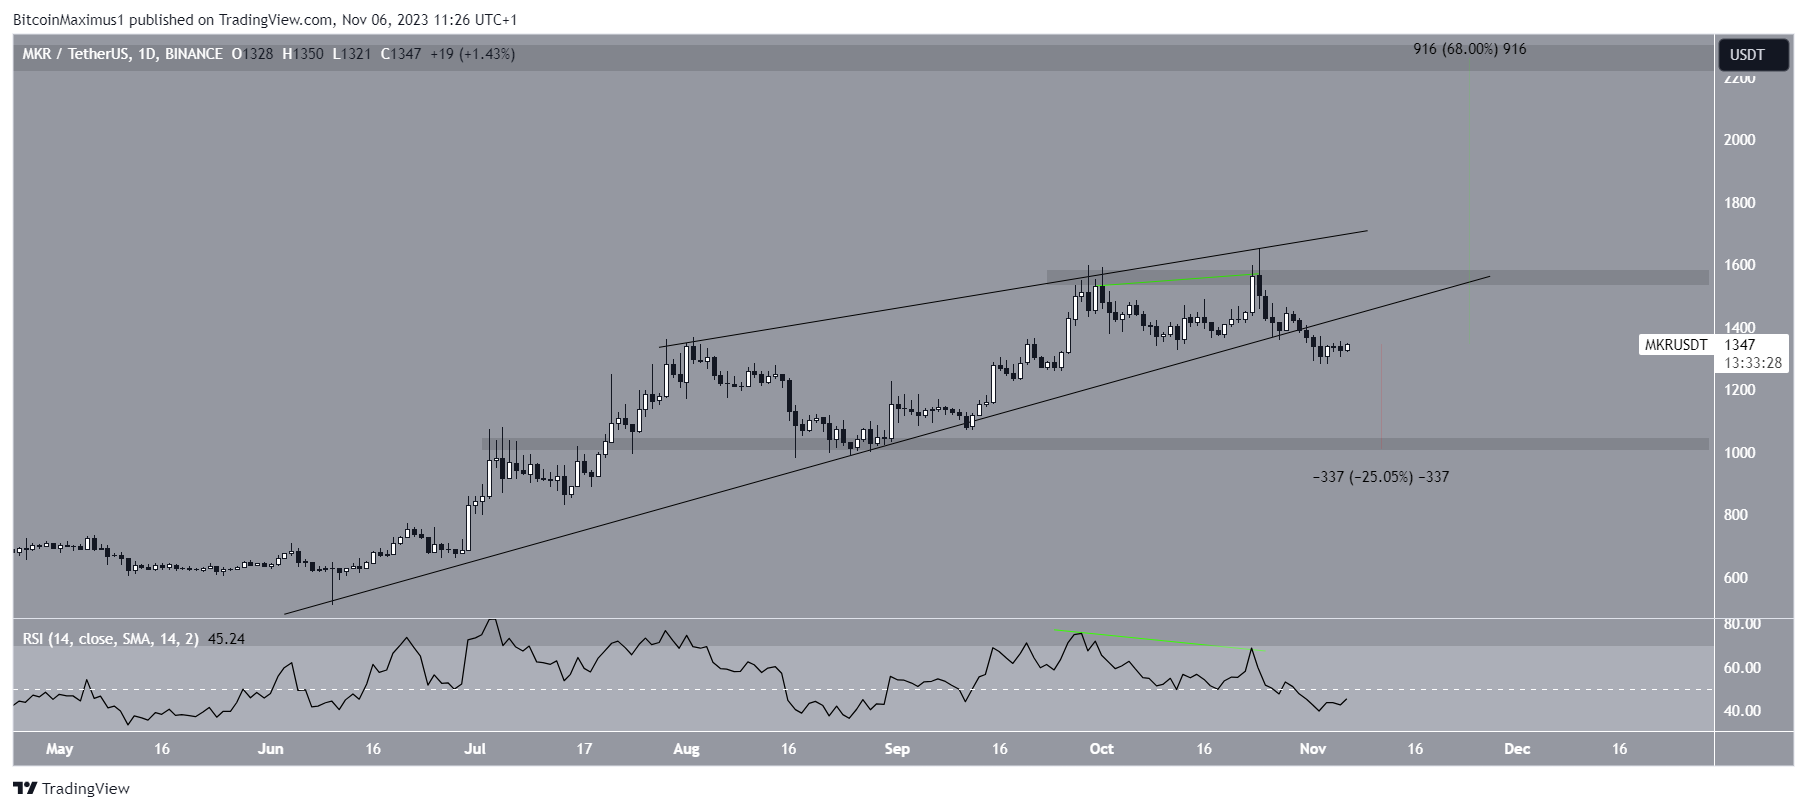
The MKR price has increased inside an ascending wedge since June. The upward movement led to a new yearly high of $1,651 on October 24. The price has fallen since.
The ascending wedge is considered a bearish pattern, meaning that it leads to breakdowns most of the time. This was the case in MKR, which broke down from the pattern on October 30.
The decrease was preceded by a bearish divergence (green) in the daily Relative Strength Index (RSI).
Market traders use the RSI as a momentum indicator to identify overbought or oversold conditions and to decide whether to accumulate or sell an asset. Readings above 50 and an upward trend indicate that bulls still have an advantage. Readings below 50 suggest the opposite.
A bearish divergence occurs when a momentum decrease accompanies a price increase. It often leads to significant downward movements, as in MKR. The fact that the divergence transpired inside an ascending wedge further increases its significance.
If the MKR downward movement continues, the MKR price can fall by 25% and reach the $1,000 horizontal support area.

Despite this bearish MKR price prediction, a breakout and close above the $1,550 resistance can cause a 70% increase to the next resistance at $2,250.
TomoChain (TOMO) Price Falls After Rejection
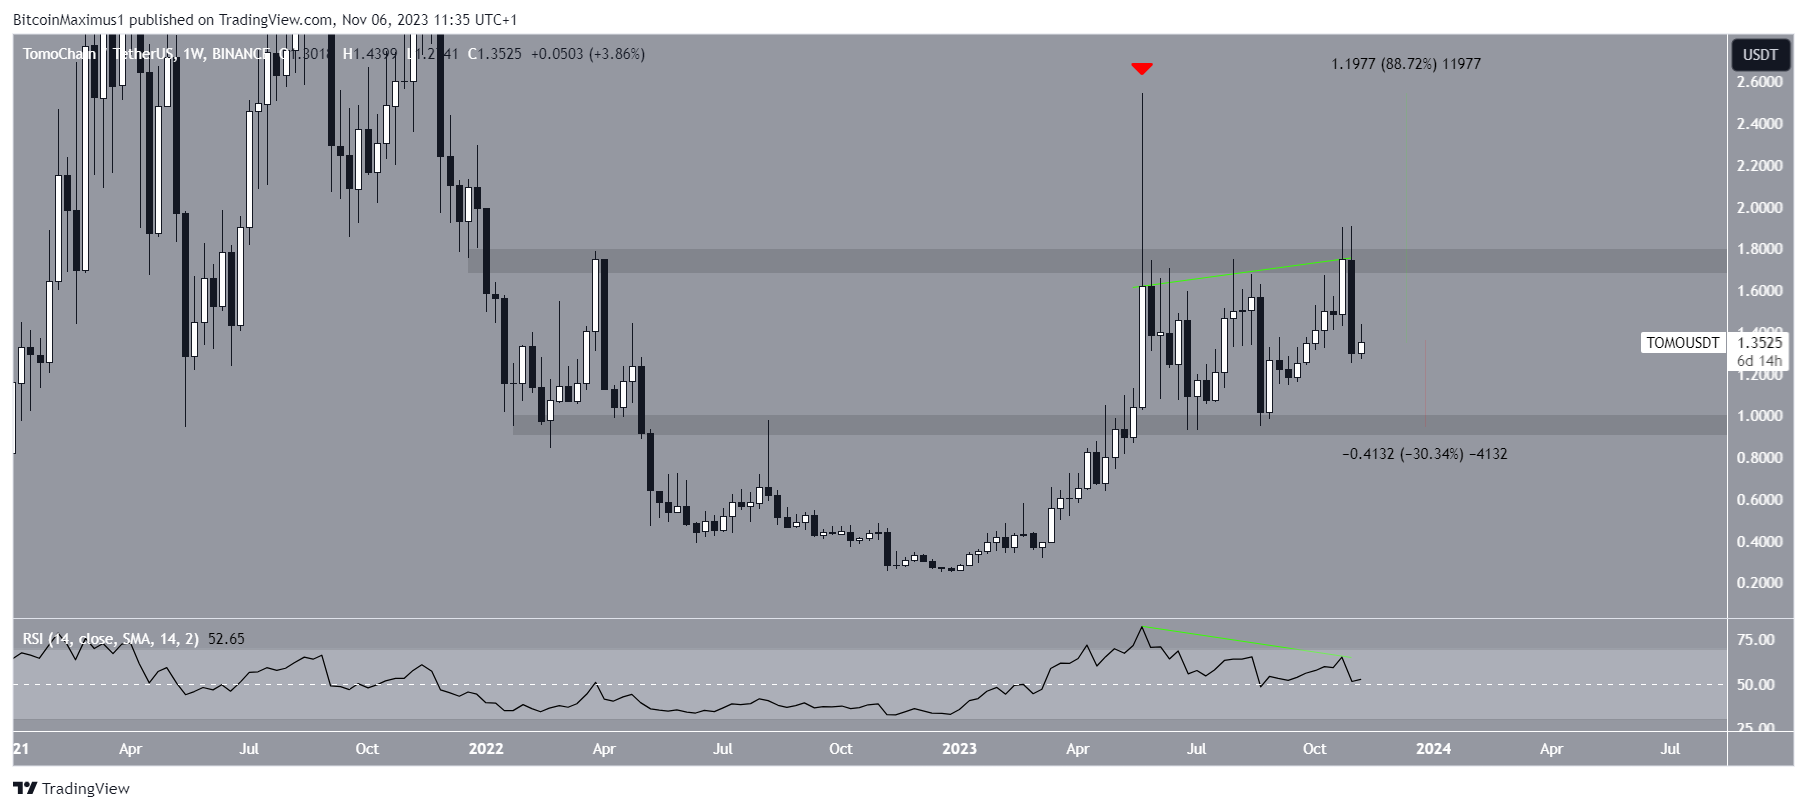
The TOMO price has fallen since reaching its yearly high of $2.55 in May. The ensuing drop created a very long upper wick (red icon) and took the price below the $1.75 horizontal resistance area.
TOMO made a failed attempt at breaking out from the $1.75 resistance area last week. However, that only served to validate the resistance area again and confirm a bearish divergence (green) in the weekly RSI.
TOMO created a bearish engulfing candlestick last week. This is a type of bearish candlestick when the entire increase from the previous period is negated in the next.
If the decrease continues, TOMO can fall by another 30% to the closest horizontal support area at $0.95.

Despite this bearish prediction, reclaiming the $1.75 area can cause a 90% increase to the yearly high of $2.45.
Apecoin (APE) Concludes Bearish Cryptos in November
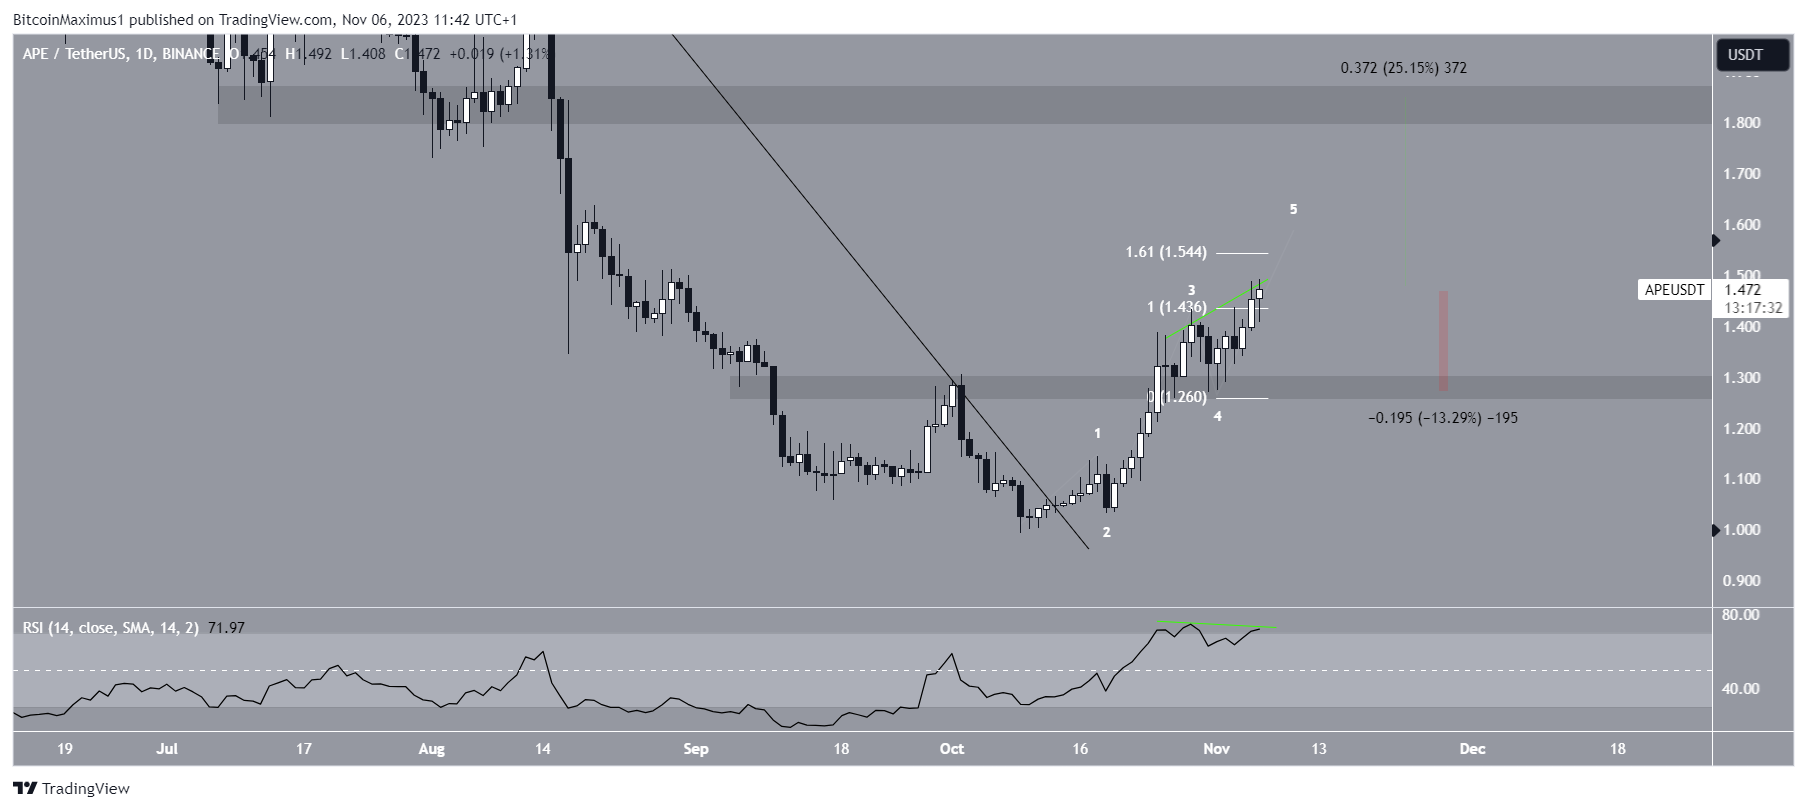
The APE price has increased quickly since breaking out from a long-term descending resistance trendline on October 13.
The upward movement led to a new yearly high of $1.49 today.
Despite the increase, the APE price may be nearing its local top due to its most likely Elliott Wave count.
Technical analysts employ the Elliott Wave theory to identify recurring long-term price patterns and investor psychology, which helps them determine the direction of a trend.
The most likely count suggests that the APE price is in the fifth and final wave of this increase. If so, it can reach a local top near $1.55. Afterward, a 13% drop to the closest support at $1.30 will be likely.

Despite this bearish prediction, an increase above the $1.55 resistance can trigger a 25% increase to the next resistance at $1.85.
For BeInCrypto’s latest crypto market analysis, click here.
 beincrypto.com
