Cryptocurrency markets are in a constant state of flux, with digital assets like Ethereum (ETH), XRP, Chainlink (LINK), Cardano (ADA), 1inch Network (1INCH), and Hedera (HBAR) capturing the attention of traders and investors. In this comprehensive crypto price analysis, we delve into the recent price movements, trends, and key technical indicators of these coins, offering insights that can help you navigate the dynamic world of cryptocurrencies.
From Ethereum’s pivotal levels to XRP’s potential reversal, Chainlink’s ascending triangle, Cardano’s impressive recovery, 1inch Network’s consolidation phase, and Hedera’s double-bottom reversal, this technical analysis provides valuable information for making informed decisions in the crypto market.
Ethereum (ETH) Price Analysis
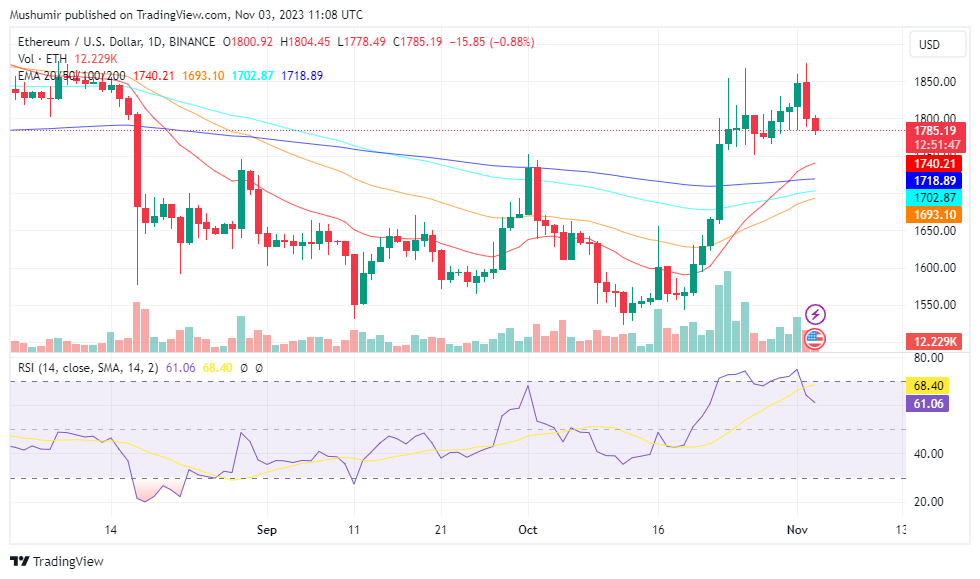
Ethereum (ETH) is currently trading at $1,785, representing a 2.73% decrease in the last 24 hours. Analyzing the daily chart, ETH faced a significant hurdle at the 200-day exponential moving average (EMA), located at $1,800. This encounter resulted in a period of sideways consolidation with minimal price fluctuations. This price range holds substantial importance, both psychologically and due to the existing supply dynamics.
Ethereum’s indecisiveness in choosing a clear direction is creating anticipation among traders. A breakout or rejection at this level is likely to define its medium-term trajectory. A successful breakout above $1,800 could initiate a strong upward trend, aiming for sturdy resistance at $2,000. Conversely, a rejection could lead to a short-term decline toward the 100-day EMA at $1,700K. Traders and investors should keep a close eye on the ETH market to make informed decisions.
XRP Price Analysis
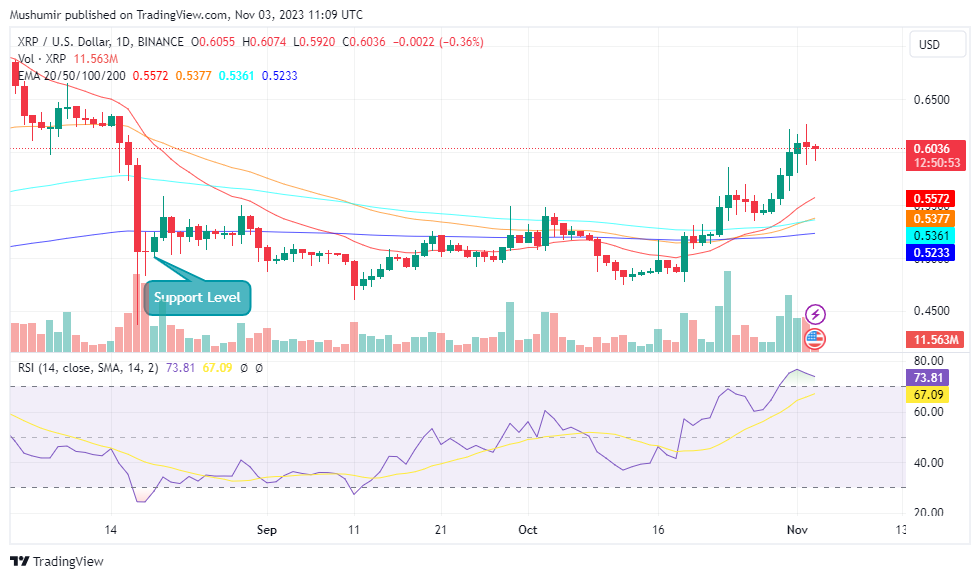
XRP is currently priced at $0.6036, experiencing a 2.21% decrease in the last 24 hours. In recent weeks, XRP’s price has experienced a strong rally. Notably, it has breached both the 50-day and 200-day exponential moving averages to the upside and is currently testing the $0.6 resistance level. Concurrently, the relative strength index (RSI) has been on the rise, entering the overbought territory.
While this bullish momentum is noteworthy, it also raises concerns about a potential bearish reversal in the short term, which we are seeing right now. The pullback could manifest either after surpassing the $0.6 level or before doing so. Nevertheless, there is some optimism for investors, as the 200-day and 50-day exponential moving averages are positioned around the $0.52 and $0.53 levels, suggesting that any correction may be relatively brief.
Chainlink (LINK) Price Analysis
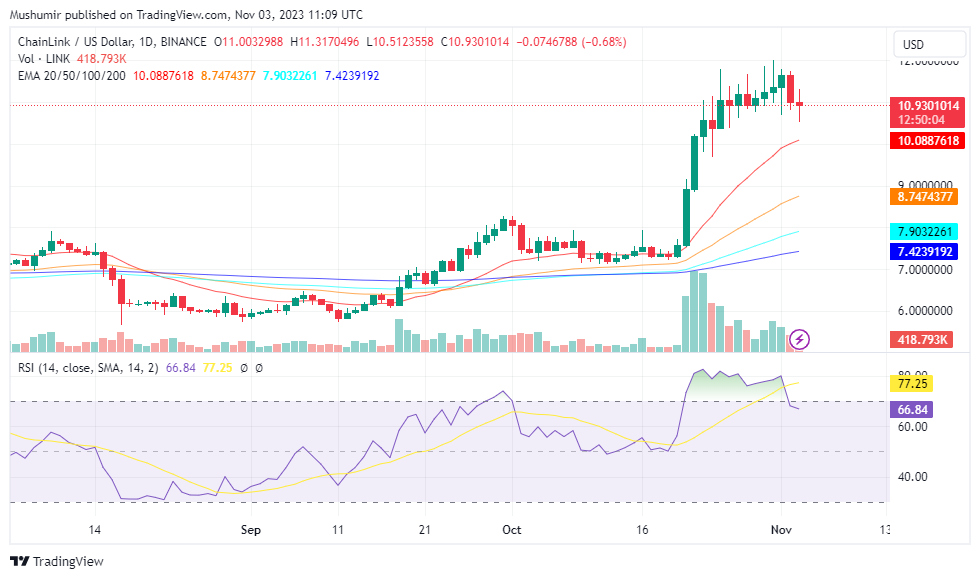
Chainlink (LINK) is trading at $10.93, reflecting a 2.45% drop in the last 24 hours. Chainlink’s pivotal point is established at $11.03, with immediate resistance at $11.74, followed by levels at $12.16 and $12.49. Conversely, initial support can be found at $10.72, with subsequent levels at $10.35 and $9.85. The RSI stands at 66.84, indicating a bullish sentiment as it hovers just above the neutral threshold of 50.
LINK’s price has surpassed its 50-day EMA of $11, signaling a short-term bullish trend. A closer look at the charts reveals an ascending triangle pattern, with support at $11.20, juxtaposed with a triple top resistance at $11.75. Typically, ascending triangles are indicative of an impending upward breakout. Overall, ChainLink is currently displaying a bullish trend above $11 and appears poised to challenge the resistance levels soon.
Cardano (ADA) Price Analysis
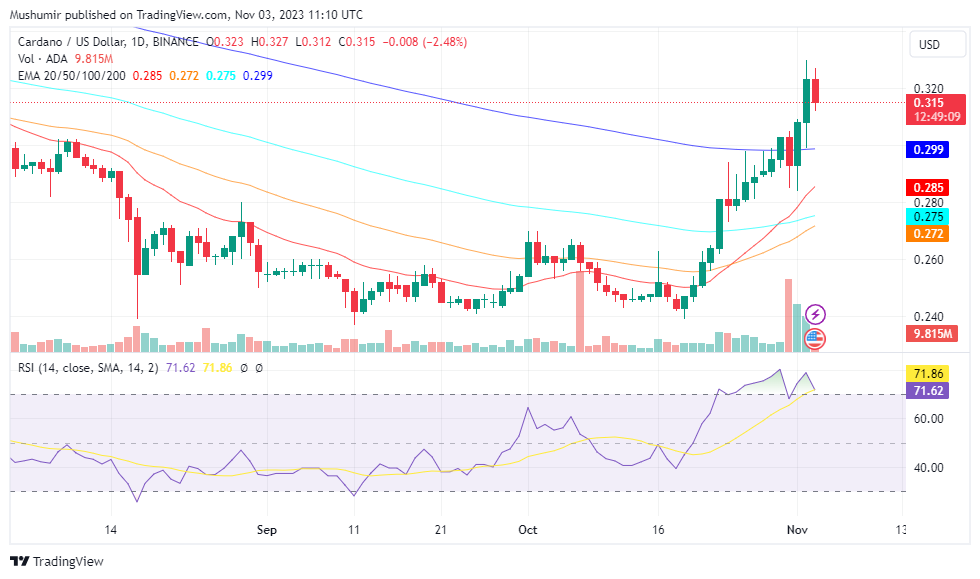
After a substantial rebound in October, Cardano (ADA) is currently valued at $0.315, marking a 2.10% increase in the last 24 hours and an impressive 11.01% rise in the last 7 days. ADA’s price has surged beyond the 200-day EMA, demonstrating a rapid 31% increase over the past 15 days. The price broke through the dynamic resistance of the downtrend EMAs and reached $0.325. Despite this impressive recovery, buyers encountered significant selling pressure at the $0.325 level.
Nonetheless, the ongoing recovery successfully reestablished the psychological milestone of $0.30, facilitated by a breakout from a symmetrical triangle pattern. Additionally, the pullback from the $0.325 level can be seen as a retest of the breakout above the 200-day EMA. In the event that Cardano’s price surpasses the $0.325 level, the breakout rally has the potential to extend to $0.40, with a notable hurdle at $0.35. Conversely, a significant pullback from $0.325 could result in a retest of the $0.30 mark.
1inch Network (1INCH) Price Analysis
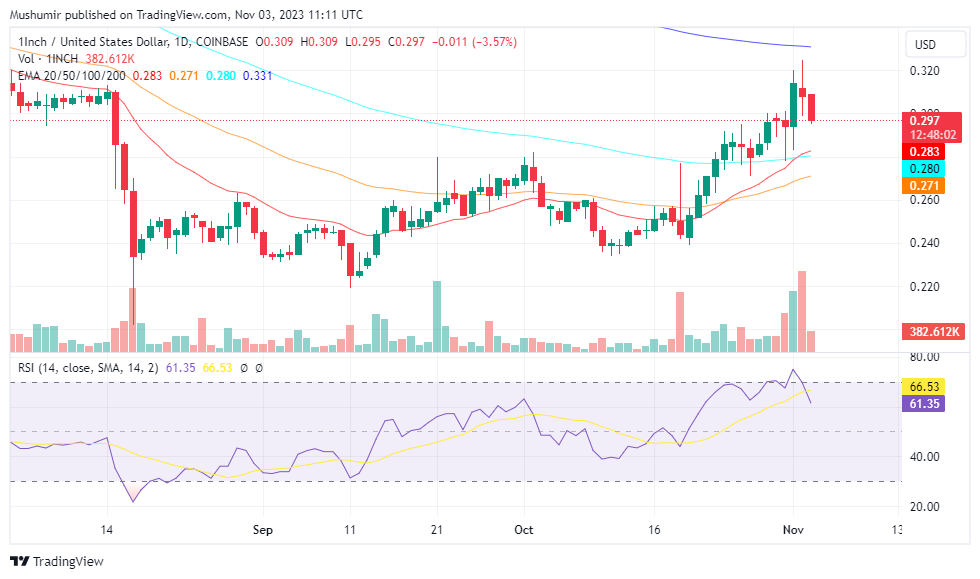
1inch Network (1INCH) is priced at $0.297, showing a 5.71% decrease in the last 24 hours. Persistent attempts by the bulls to assert control have been met with resistance, resulting in a continuous downtrend channel that keeps the 1INCH price confined. The cryptocurrency is presently caught in a consolidation phase, and market participants anticipate an imminent price movement.
The RSI of 1INCH has consistently remained above the midpoint since mid-September, reflecting substantial buying and selling activity. However, a potential bearish divergence looms as the moving averages draw near. Conversely, the Moving Average Convergence Divergence (MACD) consistently displays a histogram on the charts, underscoring significant price action. With these dynamics in mind, there’s a potential for the 1INCH price to surge to a maximum of $0.506, potentially driven by new collaborations and increased adoption within the network.
Hedera (HBAR) Price Analysis
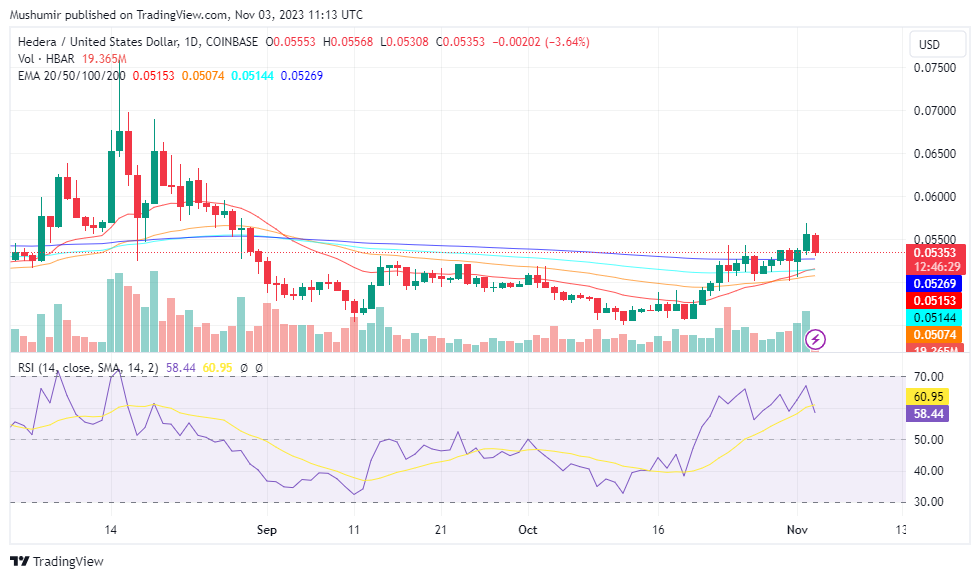
Hedera (HBAR) is currently trading at $0.05353, experiencing a 3.06% decrease in the last 24 hours. After a period of sideways movement below the $0.050 threshold and under the influence of the 50-day EMA, HBAR’s price faced significant selling pressure in the previous month. However, a notable turnaround was witnessed with a double-bottom reversal pattern emerging from a critical support level at $0.045, leading to a gradual recovery.
As the price surged above the 50-day EMA and reclaimed the psychologically significant $0.050 mark, the uptrend gained considerable momentum. Moreover, the bullish trend is now turning into a consolidation phase. However, it is also challenging the 200-day EMA and forming a promising pattern within a triangle formation. Notably, the recent recovery rally has resulted in a price increase of 15.47% over the past week.
