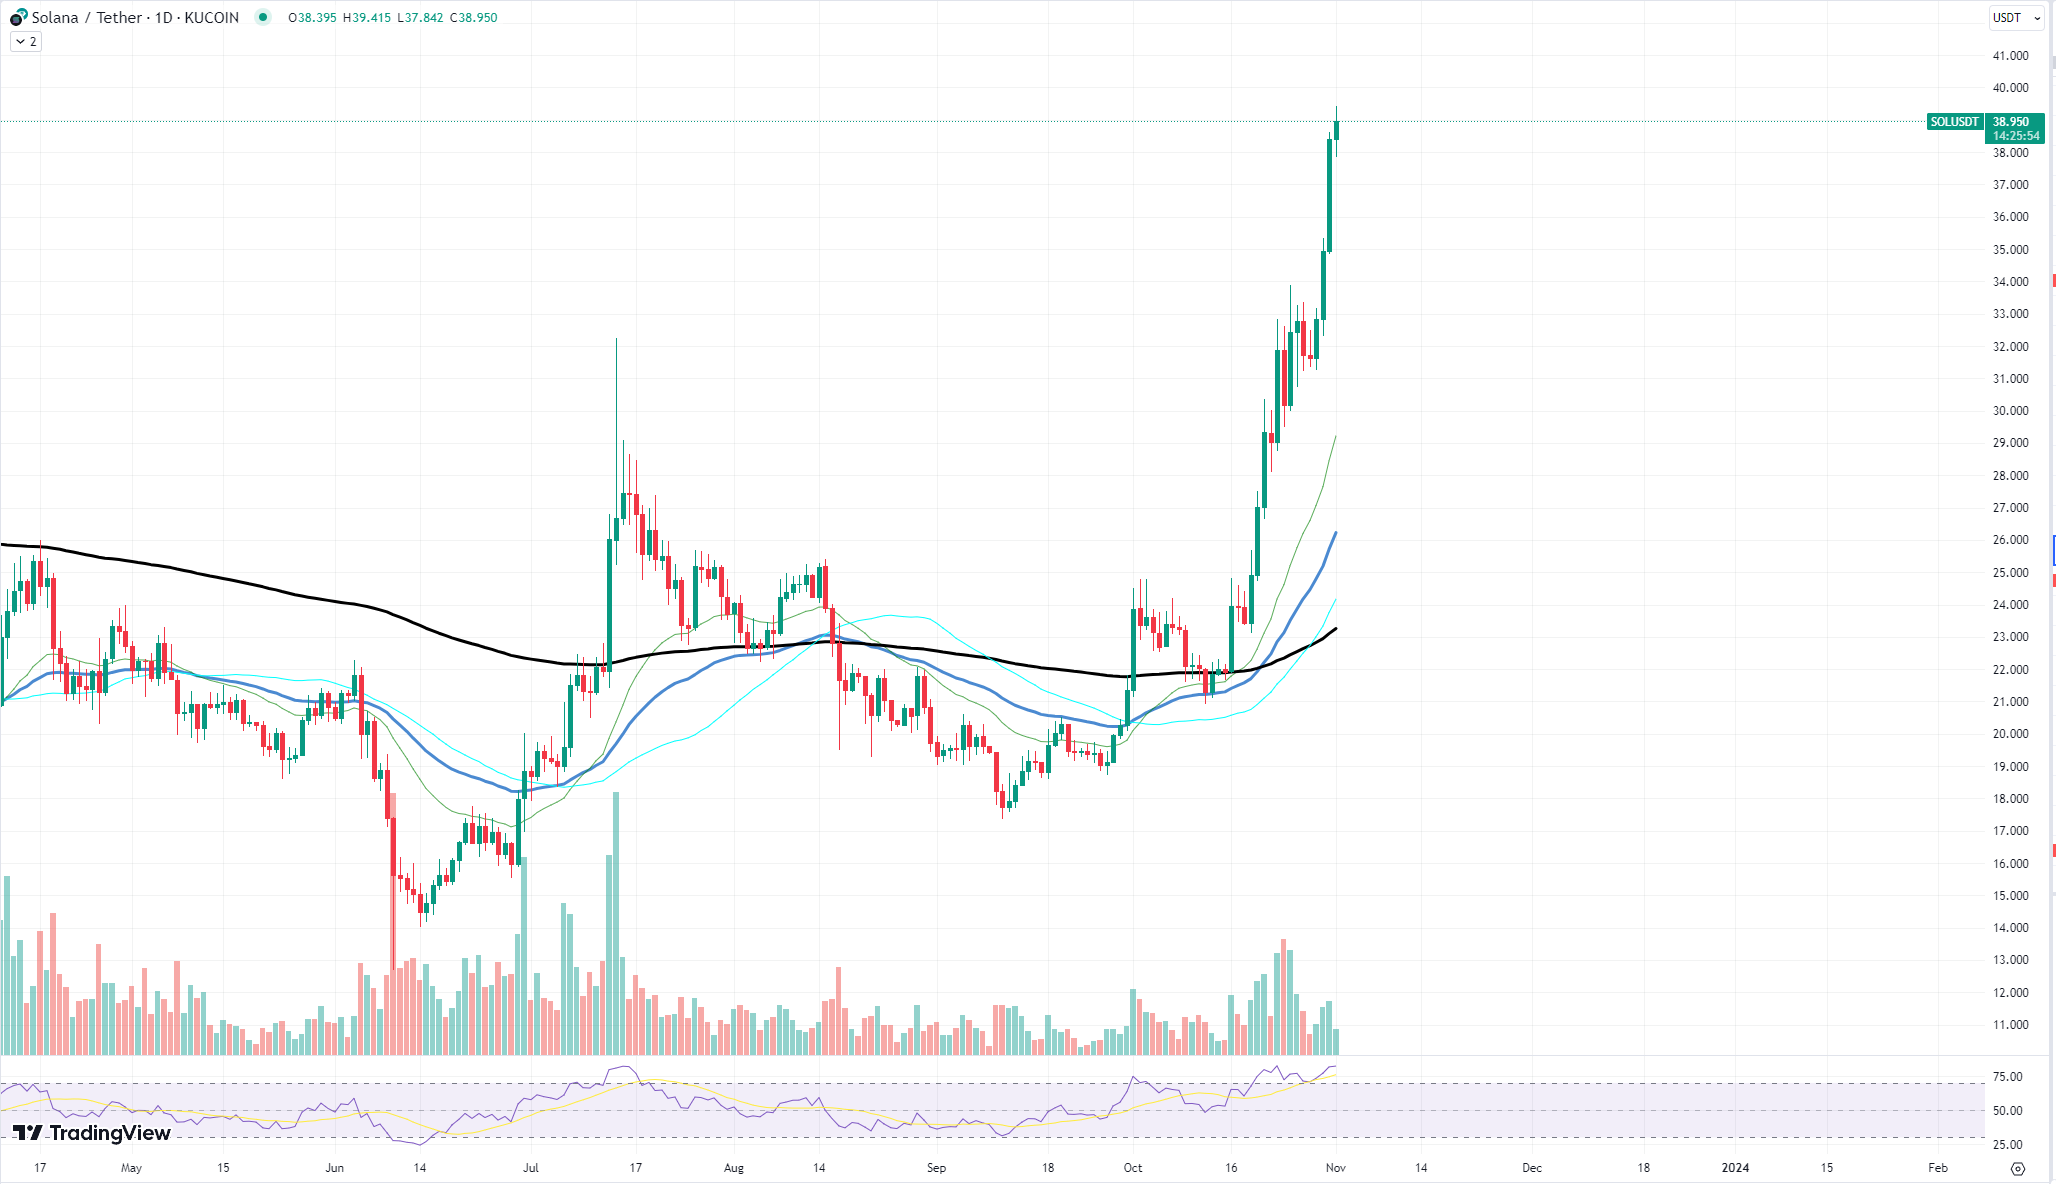
The cryptocurrency space is no stranger to volatility, and Solana (SOL) is a testament to the dynamism that this market can demonstrate. Having reclaimed its position as the seventh-largest cryptocurrency by market capitalization, SOL's performance on the daily chart paints a telling picture of its resilience and potential.
Examining the chart, one of the first indicators that stands out is the descending trading volume. A decrease in trading volume can signal many things in the cryptocurrency realm. Often, it might imply reduced interest or activity around the asset, but it can also suggest that traders are cautiously watching, waiting for the next big move. However, it is crucial to remember that reduced volume is not inherently bearish. In certain contexts, it can precede explosive moves either upward or downward, depending on other accompanying factors.

In Solana's case, the digital asset enjoyed a phenomenal +62% surge in value throughout October. This significant rise not only showcases the asset's potential but also solidifies its place on the current market. The retracement that followed some of its peaks, as visualized in the daily chart, suggests that while there have been profit-taking activities, bullish sentiment remains intact.
Furthermore, with nearly 2% of all discussions related to the top 100 assets centering around SOL, the crypto community's interest and belief in this platform are evident. This high level of engagement can often act as a precursor to more adoption, further investment and subsequently, more significant price appreciation.
However, one crucial factor to consider for any potential reversal or sustained upward movement is the volume. An increase in trading volume, particularly bullish volume, would be a definitive sign of strength and a potential continuation of the upward trajectory. Volume confirms price trends, and if SOL's price continues to climb with rising volume, it would further cement its bullish outlook.
 u.today