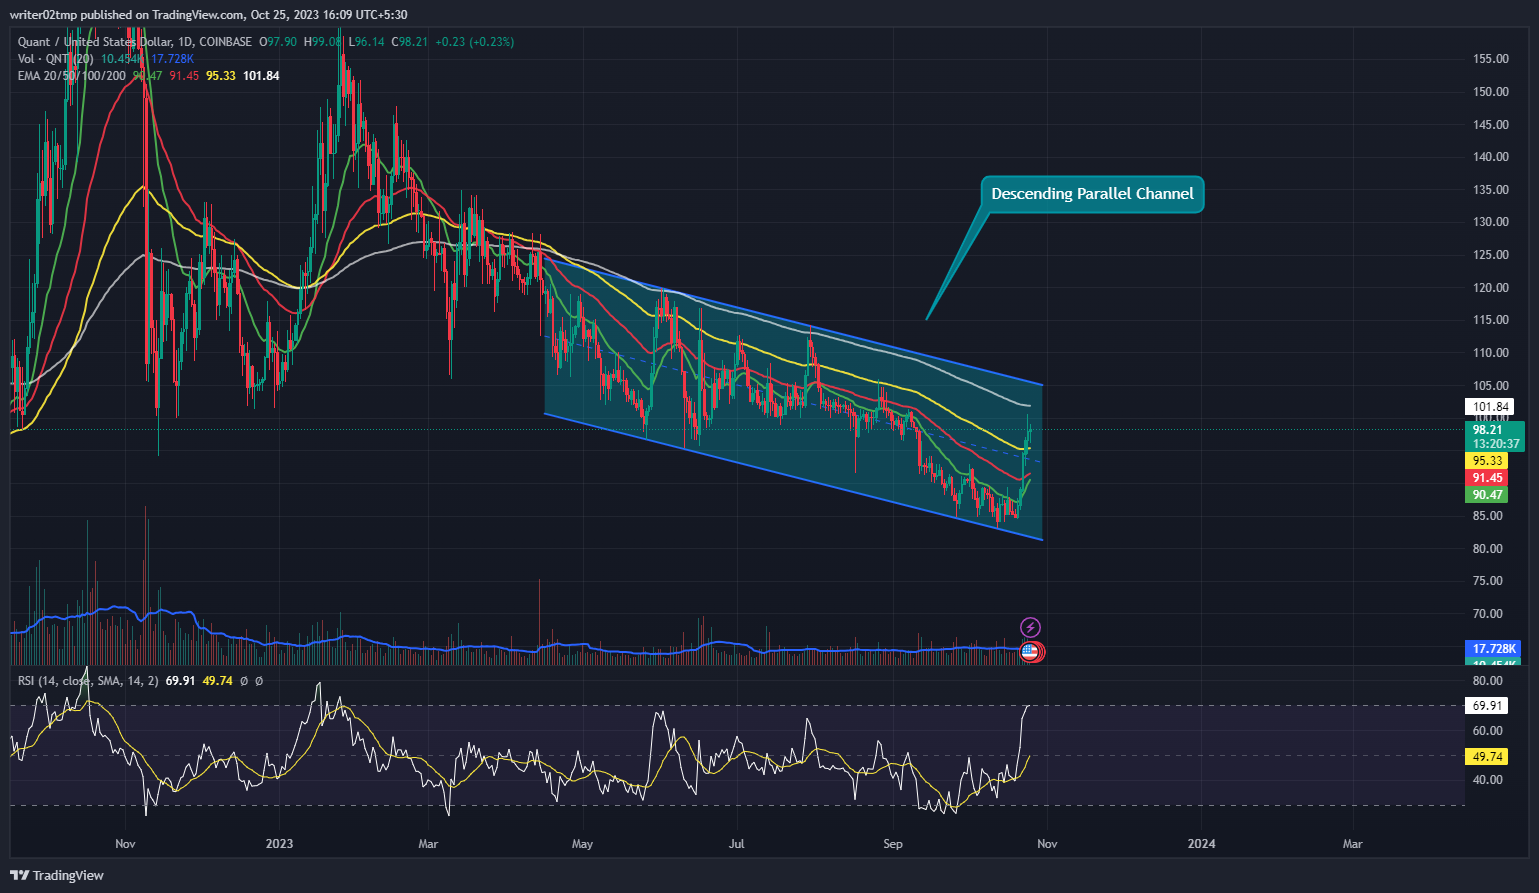
- 1 Quant price prediction shows the surge of QNT crypto towards the upper trendline of the falling pattern.
- 2 QNT crypto may break out of the declining pattern to recover maximum.
- 3 Quant cryptocurrency has recovered above 20, 50 and 100-days DMAs to reach the 200-days daily moving average.
Quant price prediction shows the recovery of QNT crypto towards the upper threshold to register its breakout from here. QNT crypto looks prepared to break out from the declining pattern over the daily time frame chart. As Bitcoin price surged towards the $35000 mark, other altcoins like Quant have also initiated their recovery phase. Now, QNT crypto needs to sustain at the upper threshold to register its breakout.
Quant cryptocurrency has been falling through an interesting descending parallel channel over the daily time frame chart since April 2023. However, at present, QNT crypto price is trading near the upper trendline of the falling channel to register its breakout.
Quant price was at $98.15 and gained around 0.31% of its market capitalization during the day’s trading session. However, trading volume has decreased by 19.44% intraday. Volume to market cap ratio was at 2.28%.
Will Quant Price Sustain or Get Detained?

Quant price forecast highlights the upward momentum of QNT crypto inside the descending parallel channel over the daily time frame chart. Now, buyers need to accumulate at a higher rate in order to sustain near the upper trendline of the channel. As QNT approaches the upper trendline, sellers’ may approach to pull QNT back inside the channel. Volume change is below average and needs to grow intraday. Meanwhile, Quant cryptocurrency recovered above 20, 50 and 100-days DMAs to reach the 200-days daily moving average.
Quant cryptocurrency gained 14.66% in a week and 11.36% in a month. However, QNT crypto slipped by 4% in the last three months and 12.97% in the last six months. In addition, Quant crypto price slumped around 6.67% year to date.
Technical indicators suggest the upward momentum of QNT crypto. Relative strength index (RSI) confirms the upside trend of Quant. RSI was at 70 and is about to enter the overbought territory. Investors in Quant cryptocurrency need to wait until QNT crypto sustains at the upper trendline of the descending parallel channel.
Summary
Quant price prediction highlights the recovery of QNT crypto towards the upper threshold to register its breakout from here. Quant cryptocurrency has been falling through an interesting descending parallel channel over the daily time frame chart since April 2023. Volume change is below average. In addition, Quant crypto price slumped around 6.67% year to date. Technical indicators highlight the upward momentum of QNT crypto. Investors in Quant cryptocurrency need to wait until QNT crypto sustains at the upper trendline of the descending parallel channel.
Technical Levels
Support Levels: $94.50 and $92.08
Resistance Levels: $100.72 and $102.65
Disclaimer
The views and opinions stated by the author, or any people named in this article, are for informational purposes only, and they do not establish financial, investment, or other advice. Investing in or trading crypto or stock comes with a risk of financial loss.
 thecoinrepublic.com