- 1 The ZCASH coin’s price increased by 4.22% over the last week and 1.64% over the last 24 hours.
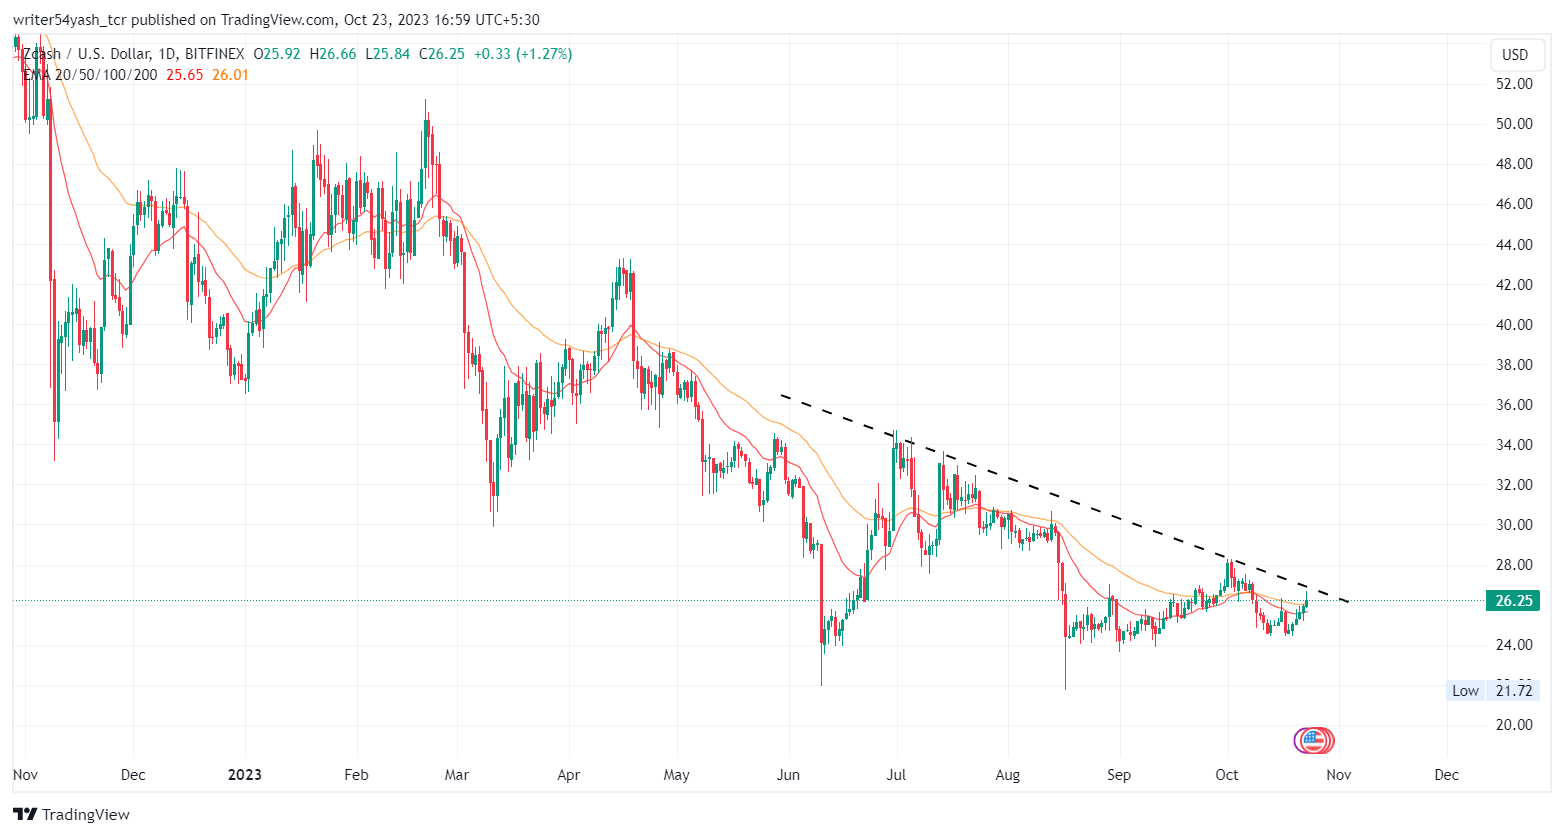
- 2 The price has taken support and started to make higher highs.
$ZEC crypto surged by 4.16% in market value and by 4.92% in trading volume in the last 24 hours, as per CoinMarketCap, which is a crypto data and info website. Its market value is $429,835,662 and its trading volume is $42,382,651. There are 16,328,269 $ZEC in circulation.
Zcash’s ($ZEC) open interest is $12.44 Million, as per Coinglass, which is a crypto analysis website. It rose 4.20% in the previous session. The long versus short ratio for 24 hours is 1.0214. The total number of short positions added in the last 24 hours is $82.68K against longs of $2.56K.
As per the Coingecko website, Zcash has 0.0175 of market dominance and holds 146 rank as per market cap. Moreover, its volume-to-market cap ratio is 0.0871 and its fully diluted value (FDV) is $552,795,923.
Will $ZEC Surpass Trendline, Boost?
$ZEC price had been falling for the past month and six months, losing 1.96% and 29.71% of its value, respectively. This shows that the investors are not confident enough and not interested much in the $ZEC crypto.
Also, the $ZEC price has been negative for the year, with a 29.65% fall, indicating that the $ZEC crypto has not recovered from the bearish trend that began earlier.
However, in the last week, the price increased by 4.22% and if it continues to rise, it might break the trendline and give investors the reward they are looking for in crypto.
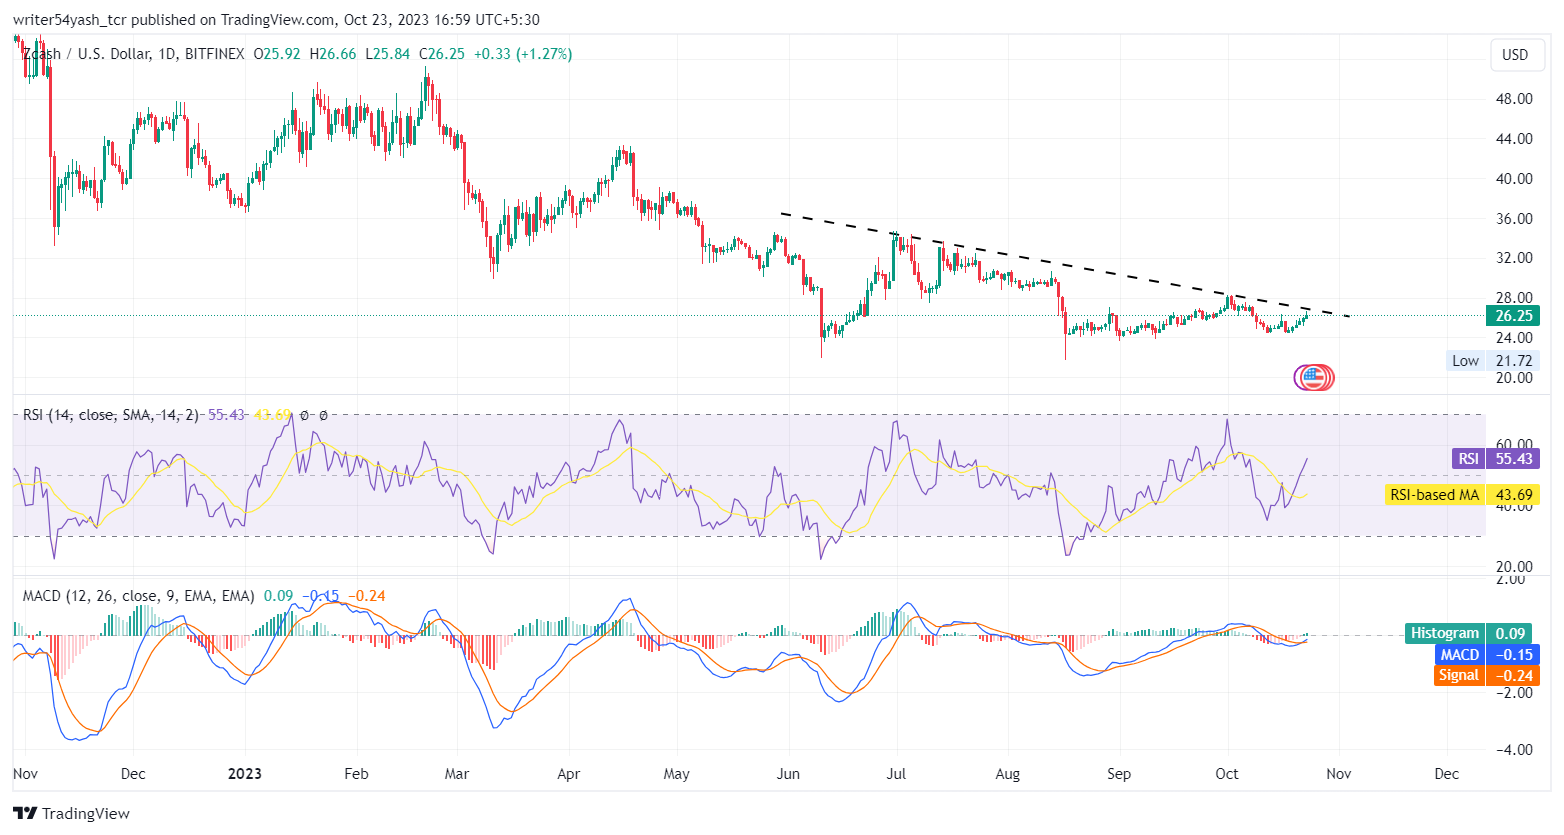
The technical analysis shows that the $ZEC price is facing a downward trendline and may fall to new support levels of $24 and $23 if the bulls do not show strength and fail to maintain the current level.
On the contrary, $ZEC price has an opportunity to increase only, if it manges to break the previous resistance levels of $27 and $28 and also if it can stabilize and surpass the previous high.


At the time of publishing, Zcash ($ZEC) is trading above the 20 and 50-day EMAs (exponential moving averages).
The MACD line at 0.14 and the signal line at 0.24 are below the zero line; both lines cross each other showing a bullish crossover.The current value of the RSI is 56.03 points and the 14-day SMA is below the median line at 43.74 points and took support from 14 SMA.
Conclusion
$ZEC price action highlights a bullish view at the time of publishing. The technical parameters of the $ZEC price show bullish traits, suggesting the continuation of the bullishness if it manages to surpass the trendline hurdle, over the daily time frame chart.
Technical Levels
- Support levels: $24 and $23
- Resistance levels: $27 and $28
Disclaimer
In this article, the views and opinions stated by the author, or any people named are for informational purposes only, and they don’t establish the investment, financial, or any other advice. Trading or investing in cryptocurrency assets comes with a risk of financial loss.
 thecoinrepublic.com
