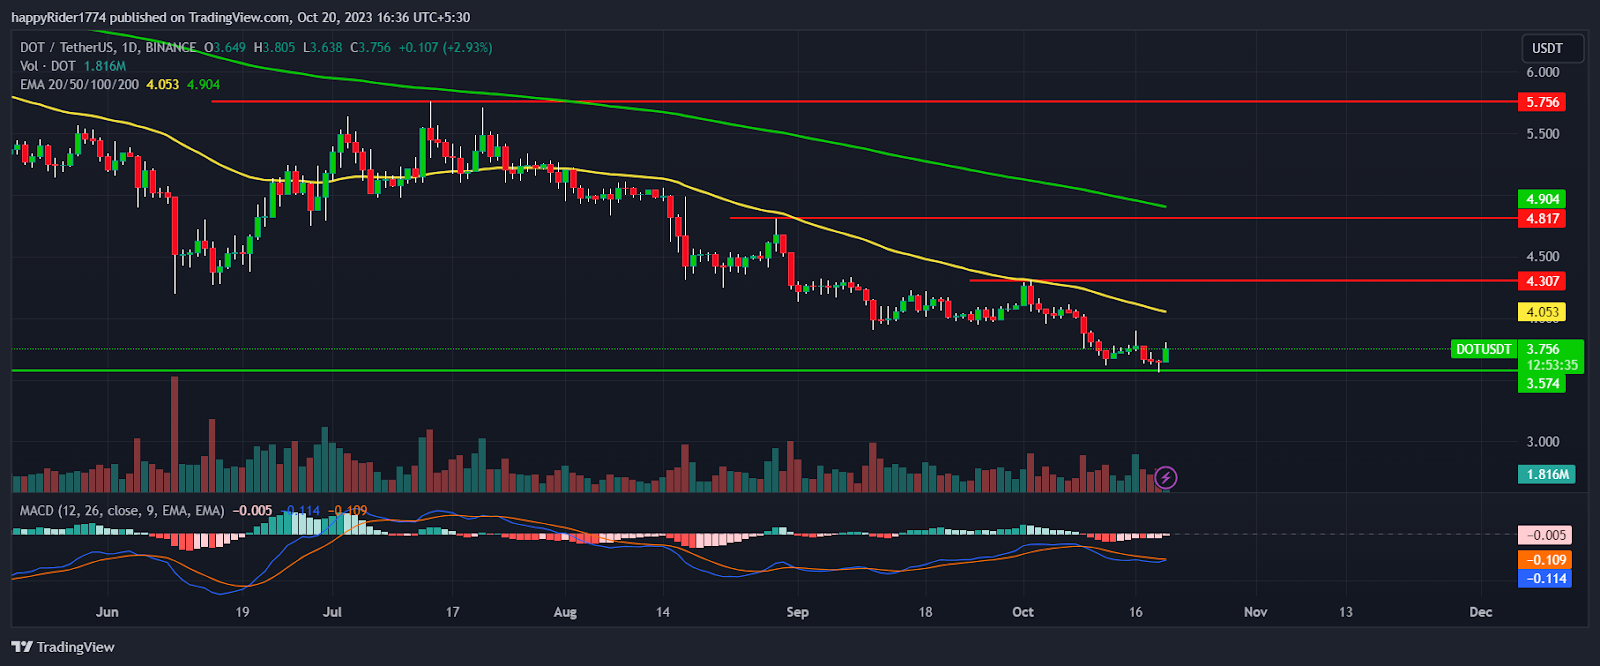
- 1 Polkadot price prediction is bullish for November 2023.
- 2 DOT price is trying to climb above the 50-day EMA.
- 3 Polkadot crypto price is trading near the multi-year low.
Polkadot price prediction is bullish for November 2023 till the crypto price sustains above the $3.500 level.
DOT price is near to the multi-year low so investors are keeping an eye on it to build a long position. If buyers succeed in defending the $3.500 level for a few weeks then a pullback rally may trigger any time from the lows.
Polkadot price is trading below the 50-day and 200-day EMA showcase the trend is in a downward direction. However, the current price looks oversold so a bounce back toward the 50-day EMA is possible.
On a higher time frame, the DOT price is forming a bearish pattern and declining by forming lower low swings. The downfall erodes the complete gain generated in 2023 and investors lose confidence.
At present, the crypto leader BTC and ETH price is bullish which improves the overall crypto market sentiment. Therefore, it may positively impact the prices of Polkadot and other altcoins.
Polkadot price is trading at $3.756 with an intraday rise of 2.93%. The 24-hour volume to market cap is 1.88%. The pair of DOT/BTC is trading at $0.0001259 with a one-day decline of -0.87%.
Will Polkadot Price Regain $4.00 by the November End?

Polkadot price prediction suggests bulls are active and preparing for the upside reversal.
Till the DOT price is sustained above the $3.500 hurdle, the short-term bulls will remain active and try their best to rebound. However, the price will pick up the momentum when buyers are able to break out of the $4.300 hurdle.
On the other hand, if the correction continues and the price drops below the $3.500 level, then bears may take control and prices hit new lows.
The technical analysis suggests, that if the DOT price climbs above the 50-day EMA then the possibility of reaching $4.00 will increase.
DOT Price Formed a Doji Candle
DOT price formed a Doji candle on the weekly time frame indicating signs of trend reversal. However, it will be interesting to see whether the buyers are able to break the previous week’s high or not.
The MACD curve slopes sideways indicating prices might spend some time in consolidation before reversing upward. The RSI at 41 slopes upward denoting bulls are getting active and if prices recover then the RSI may reach the neutral zone.
Conclusion
Polkadot price prediction is bullish and suggests a rise in the coming months. DOT price looks oversold so the possibility of more downside is low.
The technical analysis suggests DOT crypto price is near to multi-year low so buyers may come forward to push the price higher.
Technical Levels
- Resistance levels: $4.300 and $4.800
- Support levels: $3.574 and $3.400
Disclaimer
The views and opinions stated by the author, or any people named in this article, are for informational purposes only. They do not establish financial, investment, or other advice. Investing in or trading crypto assets comes with a risk of financial loss.
 thecoinrepublic.com