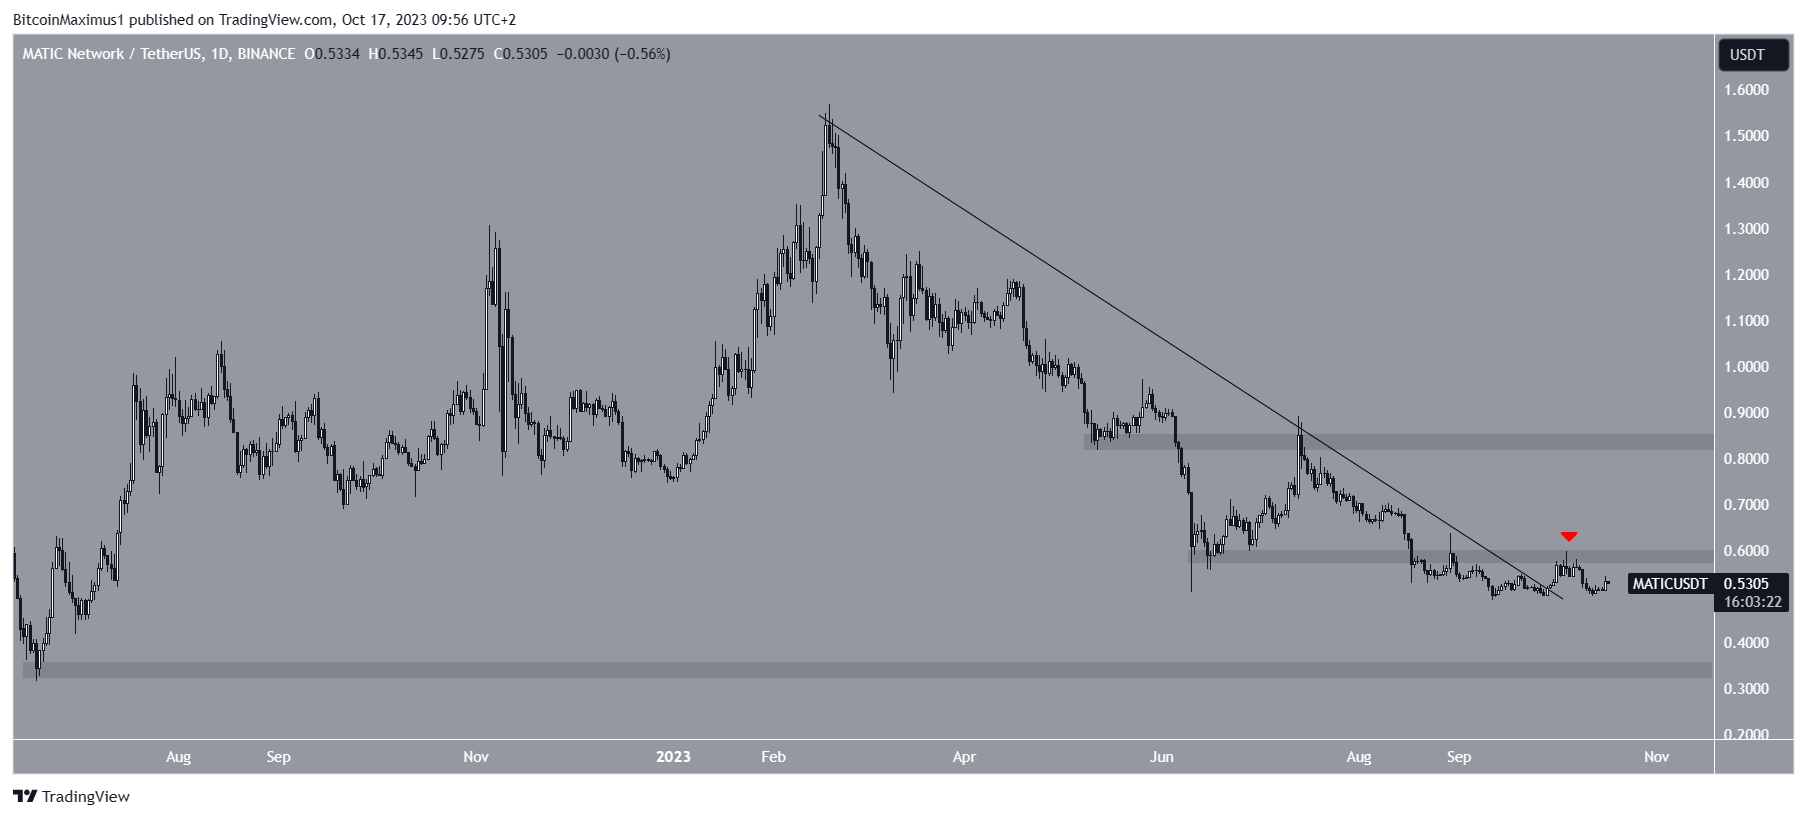
The Polygon (MATIC) price broke out from a long-term descending resistance trendline on September 29.
Despite the breakout, the price still trades below the $0.60 horizontal resistance area. With FTX and Alameda recently staking nearly $10 million in Matic – How will the price react?
MATIC Fails to Sustain Breakout
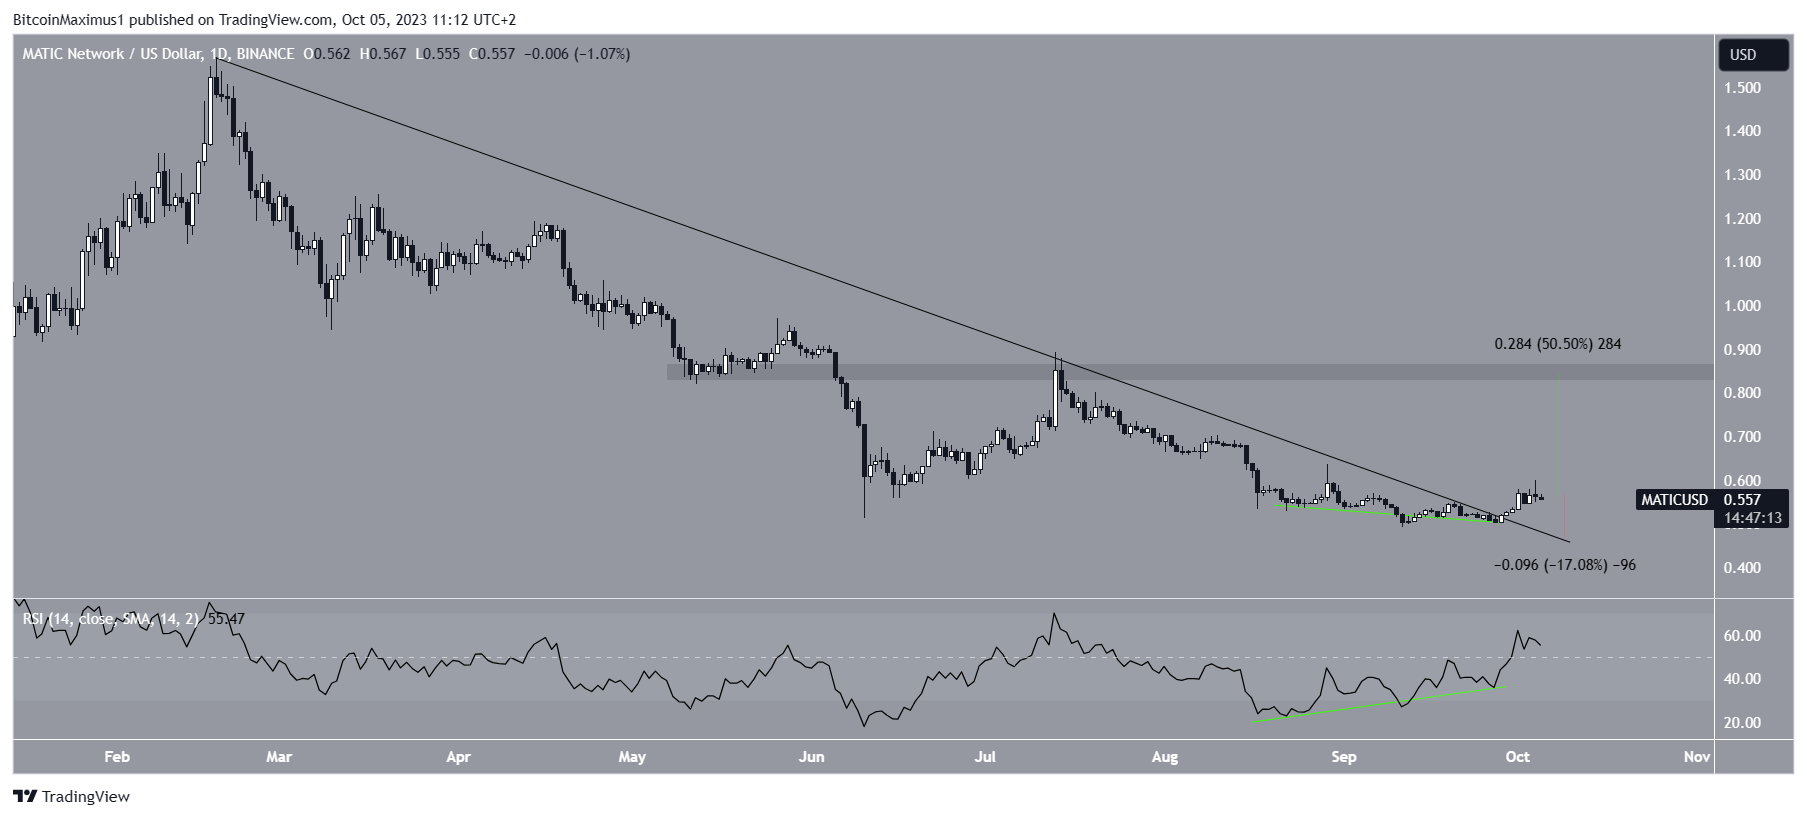
The technical analysis from the daily timeframe shows that the MATIC token price broke out from a descending resistance trendline on September 29.
Before the breakout, the trendline had been in place since the yearly high of $1.57 on February 18.
Transform your crypto game with predictive MATIC insights. Visit now.
Even though the MATIC price moved above the trendline, it did not reclaim the $0.60 horizontal area. Rather, it was rejected by it on October 5 (red icon) and began to decline, falling to its pre-breakout levels.
MATIC now trades close to its yearly low at $0.49.
Three days ago, the estate for the bankrupt exchange FTX staked 5.5 million SOL through Figment, receiving a 6.99% Annual Percentage Yield. While the estate owns nearly 56 million SOL, 42 million of it belongs to Alameda and is locked.
This particular cold storage wallet held nearly 7 million SOL and now holds 1.4 million SOL.
Today, wallets associated with Alameda and FTX also staked 16.7 million MATIC tokens worth $9.6 million.
MATIC Price Prediction: Can Breakout be Sustained?
Market traders use the RSI as a momentum indicator to identify overbought or oversold conditions and decide whether to accumulate or sell an asset.
Readings above 50 and an upward trend indicate that bulls still have an advantage, whereas readings below 50 suggest the opposite.
Read More: Best Crypto Sign-Up Bonuses in 2023
The daily RSI generated a significant bullish divergence before the MATIC price breakout (green line).
A bullish divergence occurs when a momentum increase accompanies a price decrease. It is often associated with bullish trend reversals, as in MATIC.
Even though the altcoin failed to clear the $0.60 resistance after the breakout, the divergence’s trendline is still intact.
So, if MATIC manages to close above the $0.60 resistance area, it can increase by 60% to the next resistance at $0.85.
Despite this bullish MATIC price prediction, failure to exceed $0.60 will invalidate the previous breakout.
In that case, a 36% drop to the $0.33 horizontal support area will likely be the future price outlook.
Interested in AI Trading? 9 Best AI Crypto Trading Bots to Maximize Your Profits
For BeInCrypto’s latest crypto market analysis, click here.