Cryptocurrency price analysis brought by Coinidol.com. The price of Quant (QNT) is falling below the moving average lines.
Quant long-term price forecast: bearish
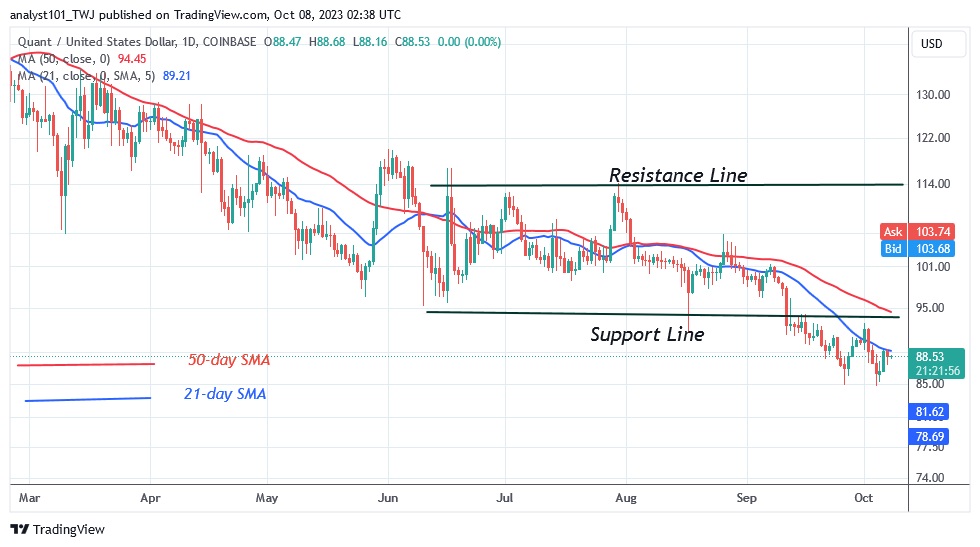
The upward movement of the price was stopped by the moving average lines. The moving average lines have prevented the positive trend of the cryptocurrency from continuing. Every time the altcoin tests or breaks the moving average lines, its price will drop even lower.
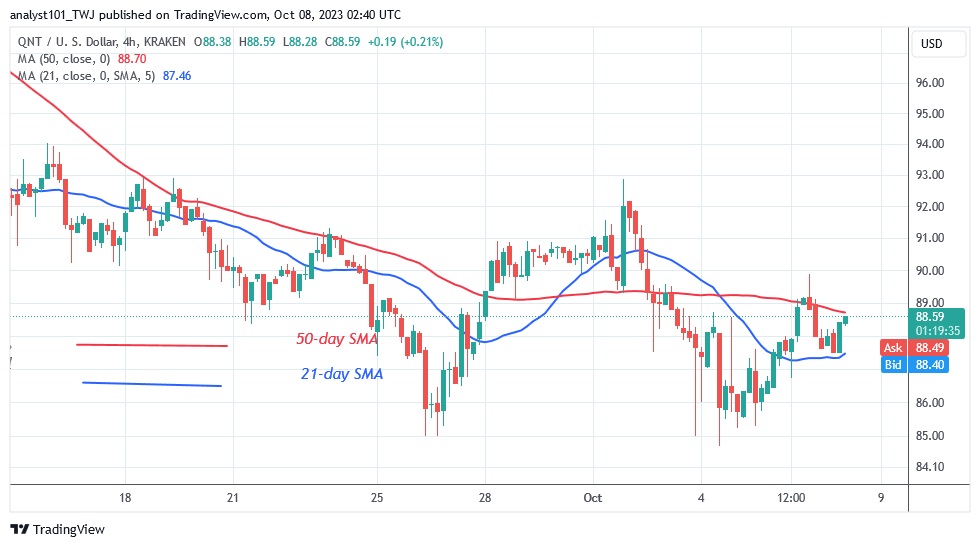
QNT made a comeback on October 1 and broke through the 21-day line SMA. The altcoin was rejected at the high of $92. The cryptocurrency hit a low of $84 as bulls bought the dips. There is a possibility that the cryptocurrency will continue to fall. At the time of writing, QNT/USD is trading at $88.
Quant price indicator analysis
The price bars for the cryptocurrency are below the moving average lines. Each time the moving average lines are retested, the price of the coin drops. Lower highs and lower lows are the pattern that the downtrend takes. The downward trend of the moving average lines indicates a decline.

Technical indicators
Key supply zones: $140, $150, $160
Key demand zones: $90, $80, $70
What is the next move for Quant?
QNT/USD is still falling below the moving average lines. The 50-day line SMA and the 21-day line SMA have been holding back the rising moves since the downturn began. On the downside, the cryptocurrency's price has been oscillating above the $85 support since September 26. The coin will continue to fall if the current support is breached.

Last week Coinidol.com reported that the upward correction of the cryptocurrency price was stopped at the 21-day line SMA. The 21-day line SMA has prevented further price gains since September 11.
Disclaimer. This analysis and forecast are the personal opinions of the author and are not a recommendation to buy or sell cryptocurrency and should not be viewed as an endorsement by CoinIdol.com. Readers should do their research before investing in funds.
 coinidol.com