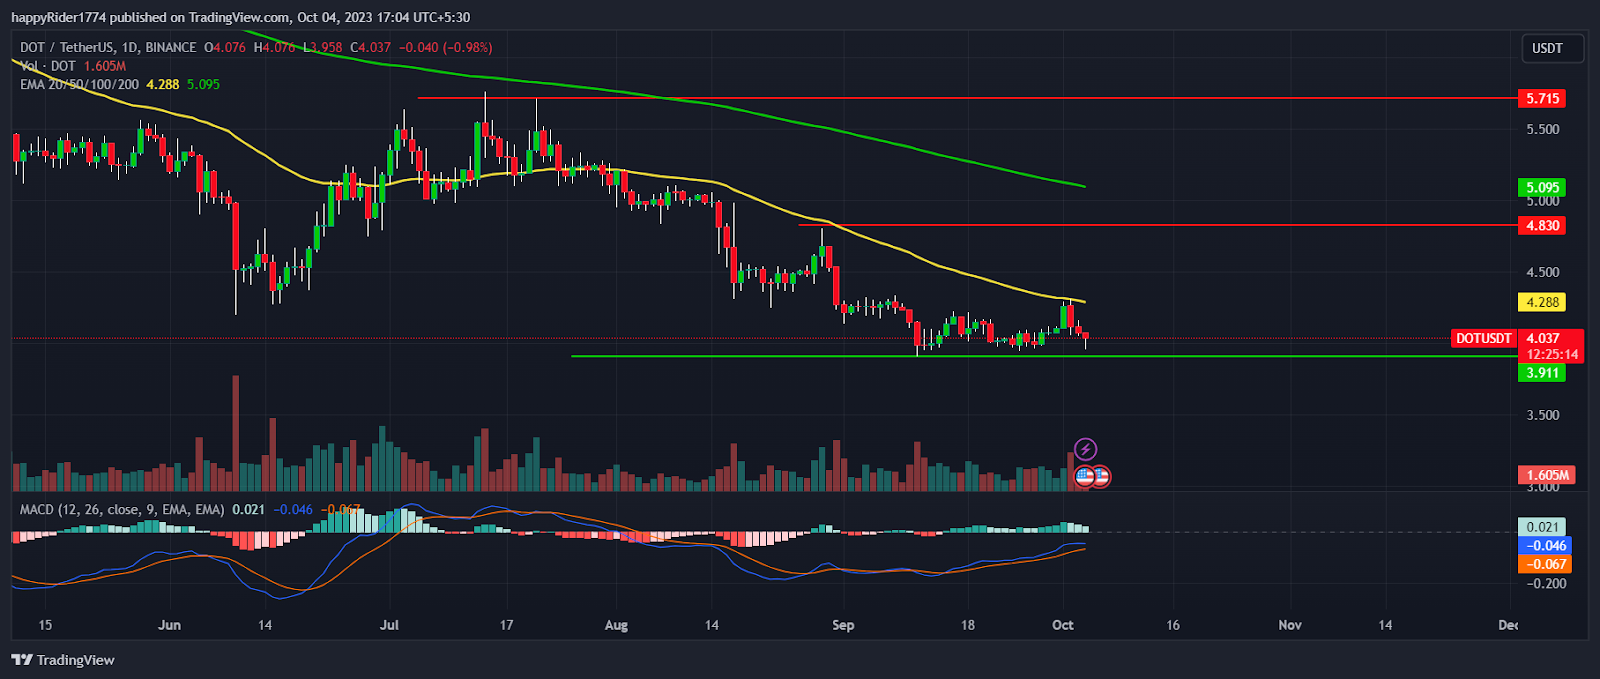
- 1 Polkadot price prediction stays bullish till it sustains above the $4.00 support.
- 2 DOT price is near its long-term demand zone.
- 3 Polkadot crypto price is trying to climb above the 50-day EMA.
Polkadot price prediction is bullish for the next month till it sustains above the $4.00 support.
DOT price seems to be consolidating in a narrow range between $4.00 to $4.30 and forming a strong base.
Recently, buyers tried to break the range upward to regain the confidence of the investors. However, the 50-day EMA turned out to be a strong hurdle that threw the price back into the range.
Polkadot crypto price is in a downtrend but the buyers are preparing for the next attempt to climb above the 50-day EMA. If they succeed, then a sharp rise toward $5.00 is possible.
The price action of DOT crypto shows that the downfall has taken a halt and buyers are trying their best to rebound.
In the past few months, DOT price had not performed well and traded with a bearish bias. However, currently, the price reached the demand zone and the sell-off is being absorbed.
Polkadot price is trading at $4.037 with an intraday decline of -0.98%. In the last 24 hours, the volume declined by 15.34% and the market cap declined by 2.11%.
Will Polkadot Price Reverse Upward From $4.00?

Polkadot price prediction suggests DOT crypto price might reverse upward and recover in the coming months.
Moreover, the crypto leader BTC and ETH price is also recovering. So, if the recovery continues, then it might improve the overall market sentiment and positively impact the DOT.
The price behavior of DOT is quite stable indicating that the speculative activities are less. So, if any short-term up move comes, then the probability of sustaining the higher level will remain high.
The analysis suggests the Polkadot price is near strong support and likely to reverse upward in the coming weeks.
Downfall in DOT Price Halted Near $4.00
DOT price is forming a bearish candle on a weekly time frame. However, the buyers are active near $4.00 so sellers are facing difficulty to pull the price further down.
The MACD curve is rising upward but the price action shows divergence. The histogram bar is green indicating the strength of the bulls. The RSI at 43 pointing south indicates weakness. However, till the price holds the demand zone, the downside risk is low.
Conclusion
Polkadot price prediction stays bullish for October 2023. DOT price had corrected a lot and tested the $4.00 crucial support. So, the possibility of further downside is low.
The analysis suggests DOT price looks cheap at current levels so long-term investors may buy or accumulate.
Technical Levels
- Resistance levels: $4.500 and $4.830
- Support levels: $3.911 and $4.000
Disclaimer
The views and opinions stated by the author, or any people named in this article, are for informational purposes only. They do not establish financial, investment, or other advice. Investing in or trading crypto assets comes with a risk of financial loss.
 thecoinrepublic.com