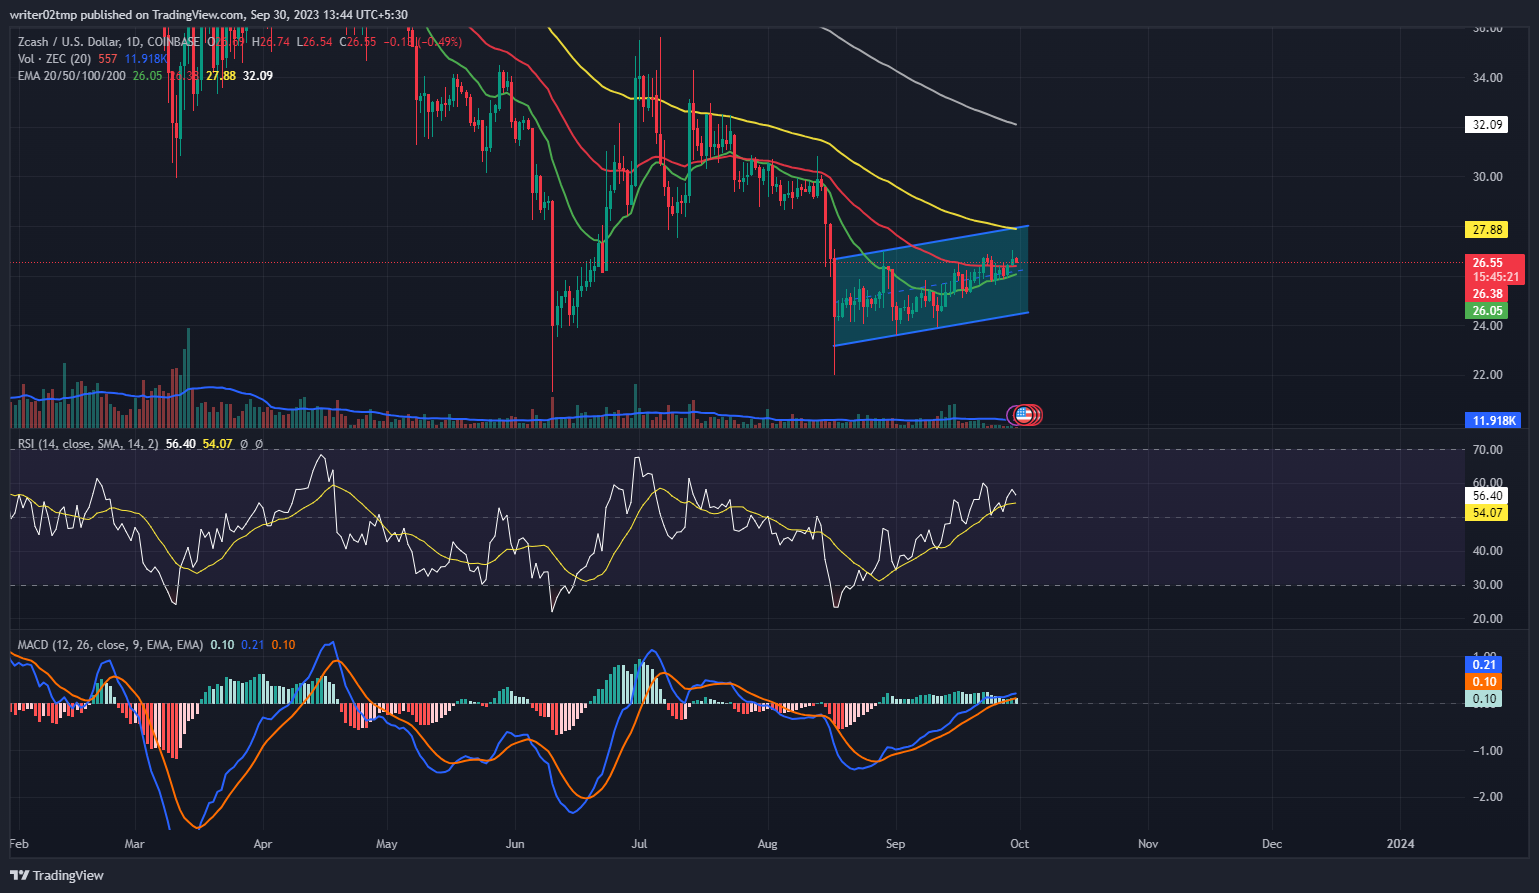
- 1 Zcash price prediction showcases the recovery of $ZEC through an interesting pattern over the daily time frame chart.
- 2 $ZEC crypto has recovered above 20 and 50-EMAs to reach the 100 and 200-days daily moving averages.
- 3 Zcash cryptocurrency declined by 28.54% year to date.
Zcash price prediction highlights the recovery of $ZEC through an interesting recovery pattern over the daily time frame chart. Meanwhile, buyers need to accumulate at a higher rate in order to push $ZEC upwards and maintain inside the rising parallel channel. Zcash crypto had an interesting roller-coaster ride before falling inside an ascending parallel channel pattern over the daily time frame chart. $ZEC crypto has been trying to recover towards the $35 recovery level but failed to maintain the uptrend.
Zcash price was at $26.55 and lost around 0.50% of its market capitalization intraday. Trading volume declined by 0.40% during the intraday trading session. This demonstrates that sellers are getting involved in the trade to pull $ZEC back towards the lower trendline of the rising parallel channel. Volume to market cap ratio was at 8.11%.
Will Zcash Price Maintain its Recovery?

Zcash price prediction indicates the recovery of $ZEC through an interesting pattern over the daily time frame chart. However, volume change was below average which signifies that sellers may accumulate to pull $ZEC during the day’s trading session. Meanwhile, $ZEC crypto recovered above the 20 and 50-EMAs to reach the 100 and 200-days daily moving averages
Zcash crypto saw a 0.34% decline over the week but gained 1.33% within the month. However, it experienced more substantial losses of 21.85% over the past three months and 27.24% over the past six months. Year-to-date, Zcash has slipped by 28.54%.
Technical indicators reveal a downward trend for $ZEC crypto within an ascending parallel channel. The relative strength index (RSI) indicates a downward trajectory, and the moving average convergence divergence (MACD) confirms the downward momentum.
With the RSI at 56, it is moving toward a neutral position. Although the MACD line is currently above the signal line, it is likely preparing for a negative crossover. Investors in Zcash cryptocurrency should consider waiting until the $ZEC price reaches the upper threshold before making decisions.
Summary
The Zcash price forecast suggests a potential recovery for $ZEC, displaying an intriguing pattern on the daily chart. Nevertheless, lower-than-average trading volume implies the possibility of sellers amassing to exert downward pressure on $ZEC during intraday. Yearly, Zcash has experienced a decline of 28.54%. Technical indicators indicate a downward trend within an ascending parallel channel for $ZEC cryptocurrency. Investors in Zcash should contemplate delaying their decisions until the $ZEC price reaches the upper threshold.
Technical Levels
Support Levels: $26.40 and $26.30
Resistance Levels: $26.80 and $27.05
Disclaimer
The views and opinions stated by the author, or any people named in this article, are for informational purposes only, and they do not establish financial, investment, or other advice. Investing in or trading crypto or stock comes with a risk of financial loss.
 thecoinrepublic.com
