Fueled by renewed optimism, Bitcoin briefly rallied back above $28,000 on Monday for the first time since August.
But the largest cryptocurrency has since pared those gains, dipping to $27,758 as of writing, down 0.85% so far today.
While Bitcoin saw an approximate 6% spike over the past 48 hours, peaking around $28,597, it has been unable to sustain the upward push.
With Bitcoin still looking bullish to start in October, what is the best crypto to buy now?
After the U.S. Congress delayed a potential government shutdown to mid-November, Bitcoin's price started to increase substantially, seeing its biggest positive price change since the end of August.
The latest Bitcoin price rally also started on the first day of October, which is historically one of the most bullish months for the cryptocurrency.
October is often referred to as "Uptober," with Bitcoin's price rising an average of 20.82% in the month since 2012. The only exceptions were October 2014 and 2018.
While Bitcoin briefly trading above $28,000 is a positive sign, the current rally risks exhaustion in the near term according to technical analysis.
Bitcoin's RSI may hit overbought territory above 70 this week. This could signal a period of pullback or consolidation following the rapid gains.
Upside potential remains for Bitcoin to test $30,000, especially if it holds strength above $28,000 in the following days.
Meanwhile, bears will try to sink the price back below the 200-week EMA near 25,736. Failing to hold that long-term support could open the door for a drop toward its previous support zone at around $24,000.
As the new trading month unfolds, THORChain, Meme Kombat, Bitcoin SV, TG.Casino, and Polygon are making a compelling case for being the best crypto to buy now, thanks to their robust fundamentals and/or bullish technical analysis.
Potential Breakout: THORChains's (RUNE) Next Move Above $2.20
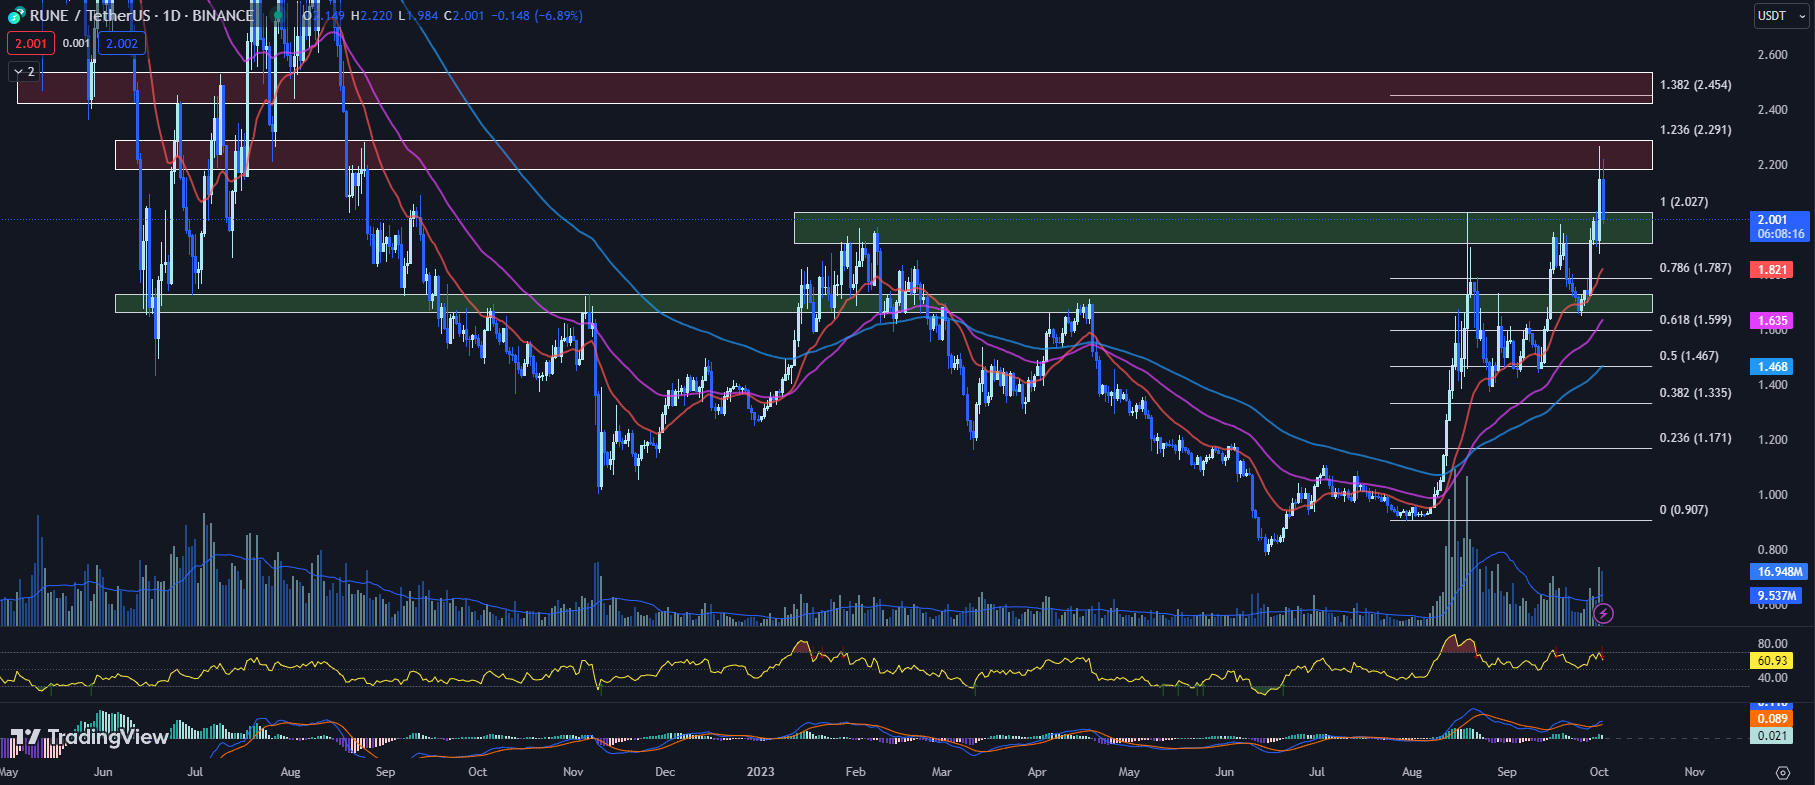
The RUNE price has seen a pullback today after a strong rally over the past month. RUNE is currently trading at $2.001, down 6.89% on the day as it retests the psychological $2.00 support level.
Looking at the key exponential moving averages, the RUNE price is still above the 20-day EMA of $1.821 and the 50-day EMA of $1.635. The 100-day EMA sits at $1.468, showing the overall bullish momentum over the past few months.
The RSI for RUNE has pulled back from yesterday's overbought reading of 70.09 down to 60.93. This shows cooling momentum but is still in bullish territory. The MACD histogram has also marginally decreased from 0.023 to 0.021, reflecting the slower upward pace.
In terms of volume and market cap, RUNE's market cap has increased 10.45% to $720.1 million over the past 24 hours while the trading volume has surged 53.28% to $264.7 million. This points to strong investor interest in the cryptocurrency.
Looking at potential resistance and support levels, RUNE faces immediate overhead resistance between $2.184 and $2.291. This resistance zone aligns with the Fib 1.236 level at $2.291.
On the downside, previous resistance between $1.914 and $2.027 may now act as support. RUNE is currently retesting this area and traders should watch for a strong bounce off this zone to confirm it as support before entering new long positions.
While the RUNE price has pulled back today, the technicals still suggest an upward trend is intact
A breakback above $2.20 could see RUNE continue higher, while a drop below $1.90 support would point to a deeper correction ahead. Traders should watch key levels heading into next week.
Gaming with Memes: Why Meme Kombat Is the Best Crypto to Buy Now
Over $210,000 has recently poured into the presale of Meme Kombat, a new cryptocurrency gaming platform bringing meme coin mascots to life through simulated artificial intelligence-powered battles.
The presale primes the full release of Meme Kombat, where users can wager on fights between their favorite meme characters. The project represents an intriguing fusion of blockchain technology, gaming, and crypto memes.
As described in Meme Kombat's whitepaper, users can wager tokens on meme coin battles as they unfold in real time. The outcomes of these matches are determined programmatically based on each character's attributes, allowing for transparent and verifiable results.
Several factors are driving significant early interest in $MK. The token offers staking rewards with an APY currently over 110%, providing passive income for holders.
$MK also serves as the currency for placing bets and receiving payouts on Meme Kombat's platform. Additionally, the project's unique theme and ties to meme coin culture make it well-positioned to generate significant hype in the crowded meme coin space.
Meme Kombat's presale is being held at a starting price of $1.667 per $MK, valuing the project at a $20 million market capitalization.
The presale seeks to raise up to $10 million, selling 50% of the total supply. 30% of tokens are allocated to staking rewards and gameplay, with the remainder going to liquidity and community initiatives.
As the interest in Meme Kombat grows among crypto investors, $MK is shaping up to be the best crypto to buy now in 2023.
The presale is ongoing, and interested participants still have a chance to acquire the token at a discounted price. But with demand escalating rapidly, the window of opportunity may not remain open for much longer.
BSV Price Surge: Overcoming Rangebound Trading for the Past Six Weeks
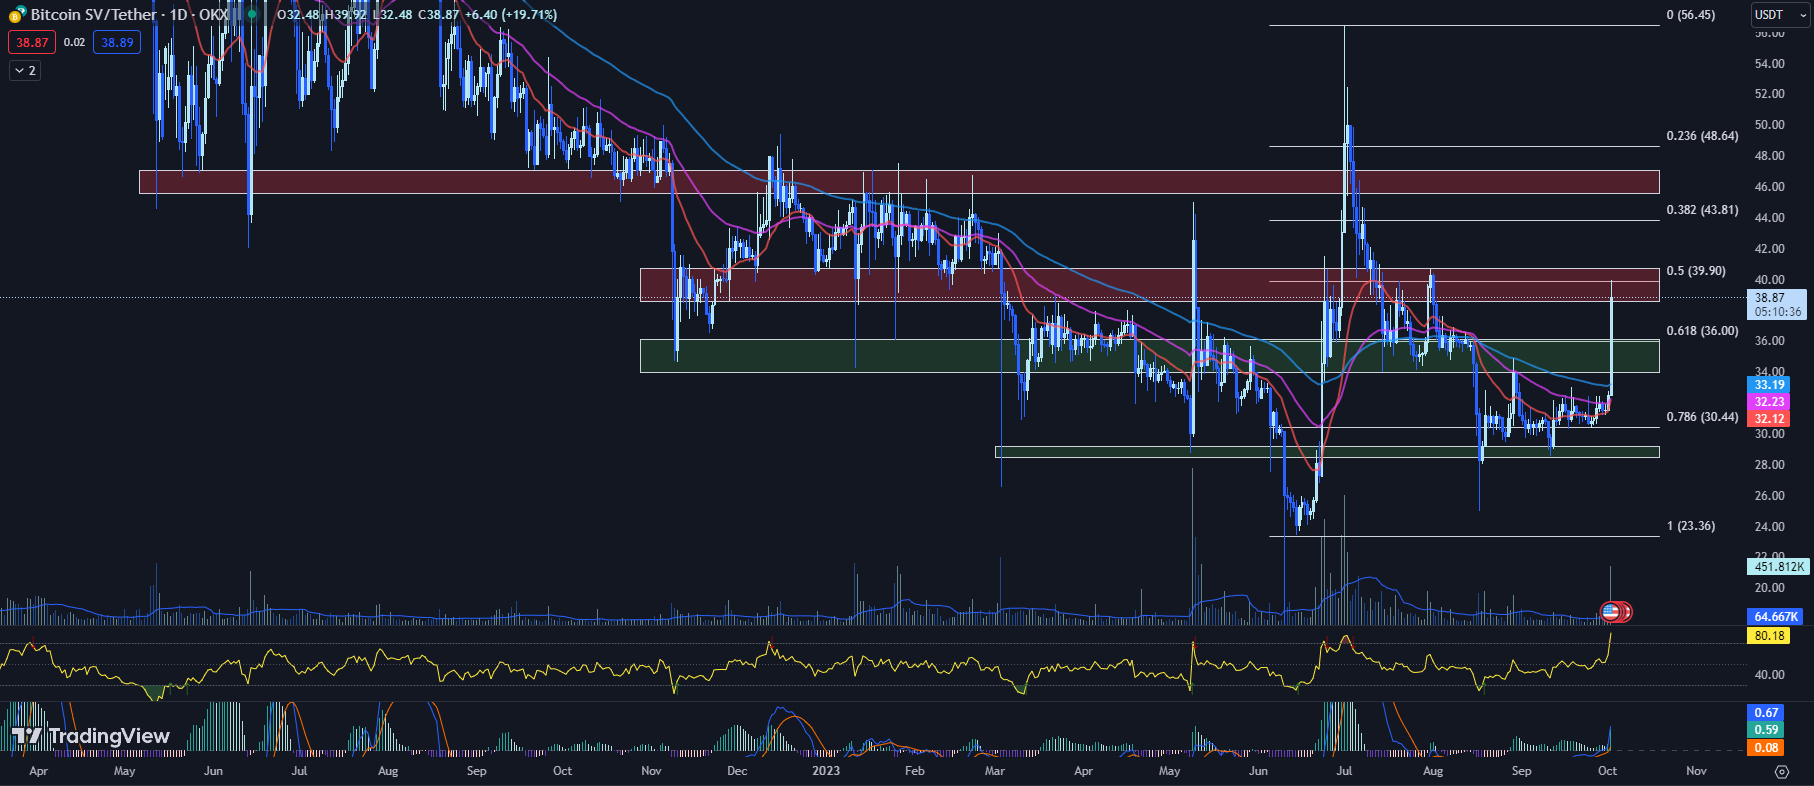
The Bitcoin SV (BSV) price has seen a dramatic upswing today, with the coin gaining over 19% to set a new local high of $39.92. This surge comes after a period of rangebound trading between $30 and $33 for the past six weeks.
The BSV price is now facing horizontal resistance between $38.60 and $40.71. This zone aligns with the key Fib 0.5 level of $39.90. For the rally to continue, the BSV price will need to decisively break above this area.
The technical indicators reflect the bullish momentum. The 20-day EMA currently stands at $32.12 while the 50-day EMA is at $32.23. With the BSV price well above these short and long-term EMAs, this shows a strong upward trajectory.
The RSI has surged to 80.18, up significantly from yesterday's 58.72. This indicates the BSV price is in overbought territory after the recent parabolic move. Some pullback or consolidation can be expected before further gains.
The MACD histogram has turned positive at 0.59, a sharp rise from 0.16 yesterday. This illustrates the strengthening of bullish momentum.
In terms of support levels, the BSV price has immediate support between $33.95 and $36.11. This zone aligns with the Fib 0.618 level at $36.
As long as the BSV price holds above this area, the uptrend can continue toward the next resistance zone.
Hit the Jackpot with TG.Casino: Crypto Games at Your Fingertips on Telegram
TG.Casino is making an ambitious play by directly incorporating crypto games into Telegram. If successful, this integration could open crypto gambling to a wider mainstream audience.
TG.Casino adds a crucial ingredient lacking in earlier crypto gambling projects like Rollbit and Stake.com - the intuitiveness and accessibility of Telegram's interface.
Rather than navigating a separate platform, Telegram users will be able to play and manage games through automated bots.
With 700 million active monthly Telegram users, TG.Casino has tremendous reach potential. The project enters a crypto gambling market well-positioned for massive expansion potential as online gambling shifts toward decentralized and mobile-first models.
TG.Casino wants to claim a sizable portion of this market by removing friction through Telegram.
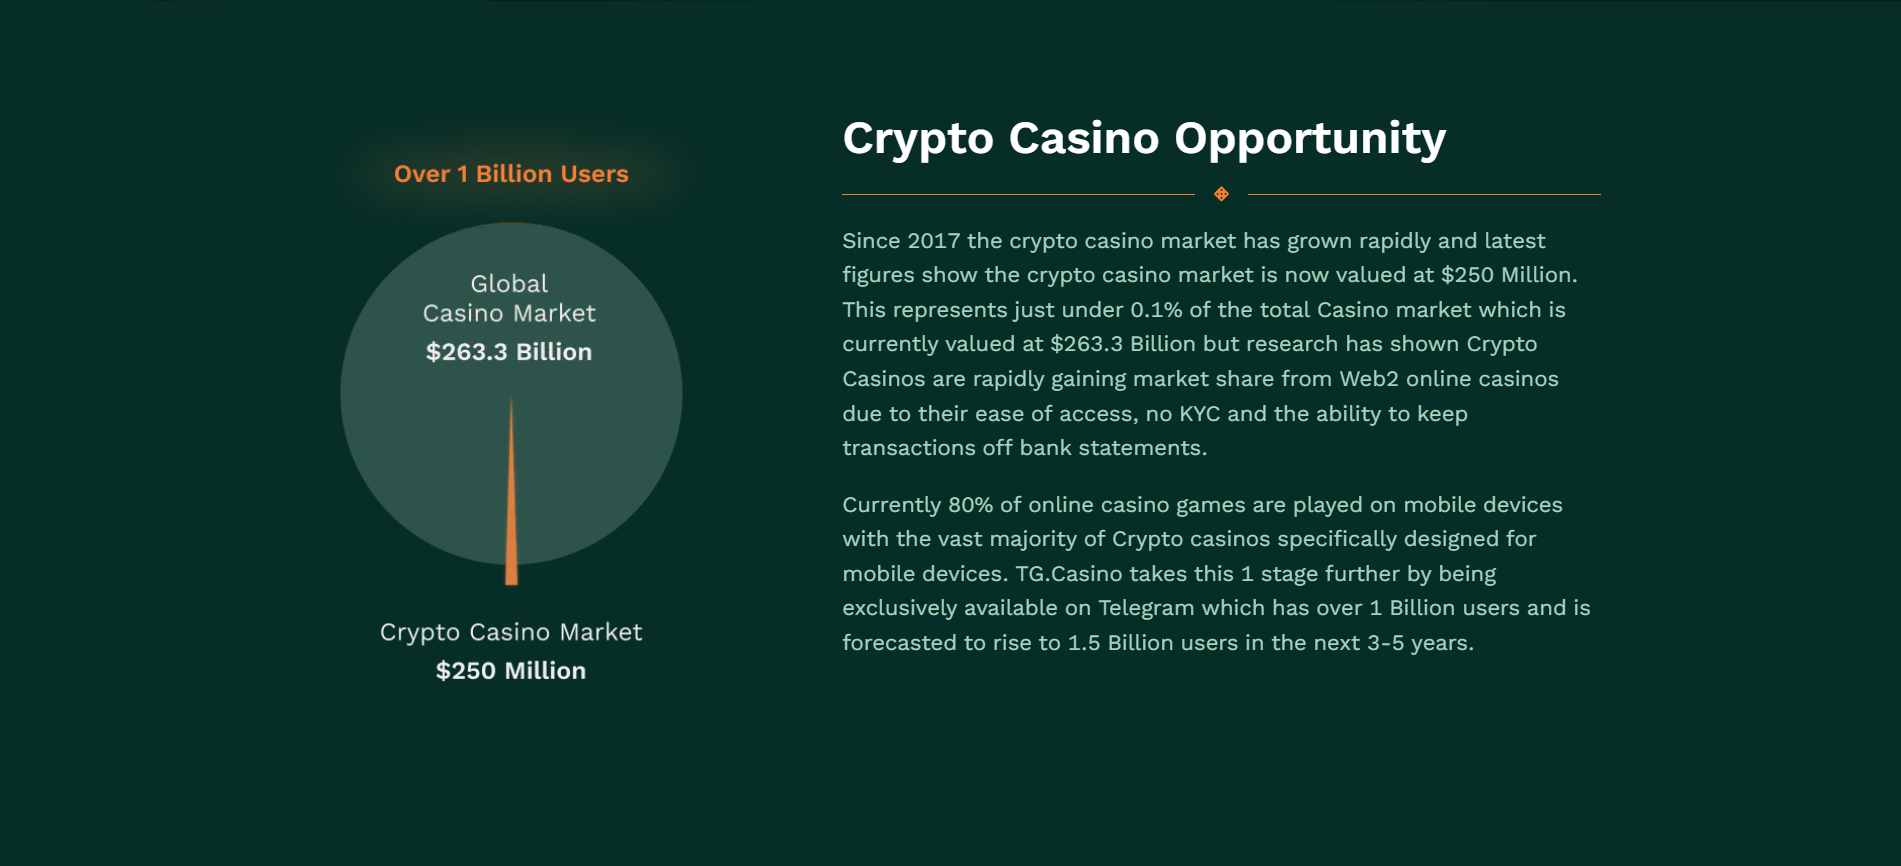
According to TG.Casino, mobile devices already account for 80% of online casino gaming. Crypto models are gaining a share by offering no-KYC and discreet transactions. Telegram integration could accelerate adoption.
To fund growth, TG.Casino is selling $TGC tokens in an ongoing presale. The presale's high staking rewards incentivize long-term holding. TG.Casino will use profits to buy back and burn tokens, further benefiting holders.
Presales for comparable crypto projects have reached $200 million valuations. With its focus on user experience and marketing through Telegram, TG.Casino hopes to follow suit and become one of the top players in crypto gambling.
Some analysts say TG.Casino's tokenomics are an advance over previous crypto presales. The supply split ensures investors, stakers, liquidity and operations all benefit.
The presale's strong early reception indicates enthusiasm for TG.Casino's potential to take crypto gambling mainstream through Telegram integration. It's still early days for web3 casinos, but the total addressable market is enormous at over $260 billion.
Visit TG.Casino Now
Bulls Hopeful as Polygon (MATIC) Price Eyes Resistance at $0.6000
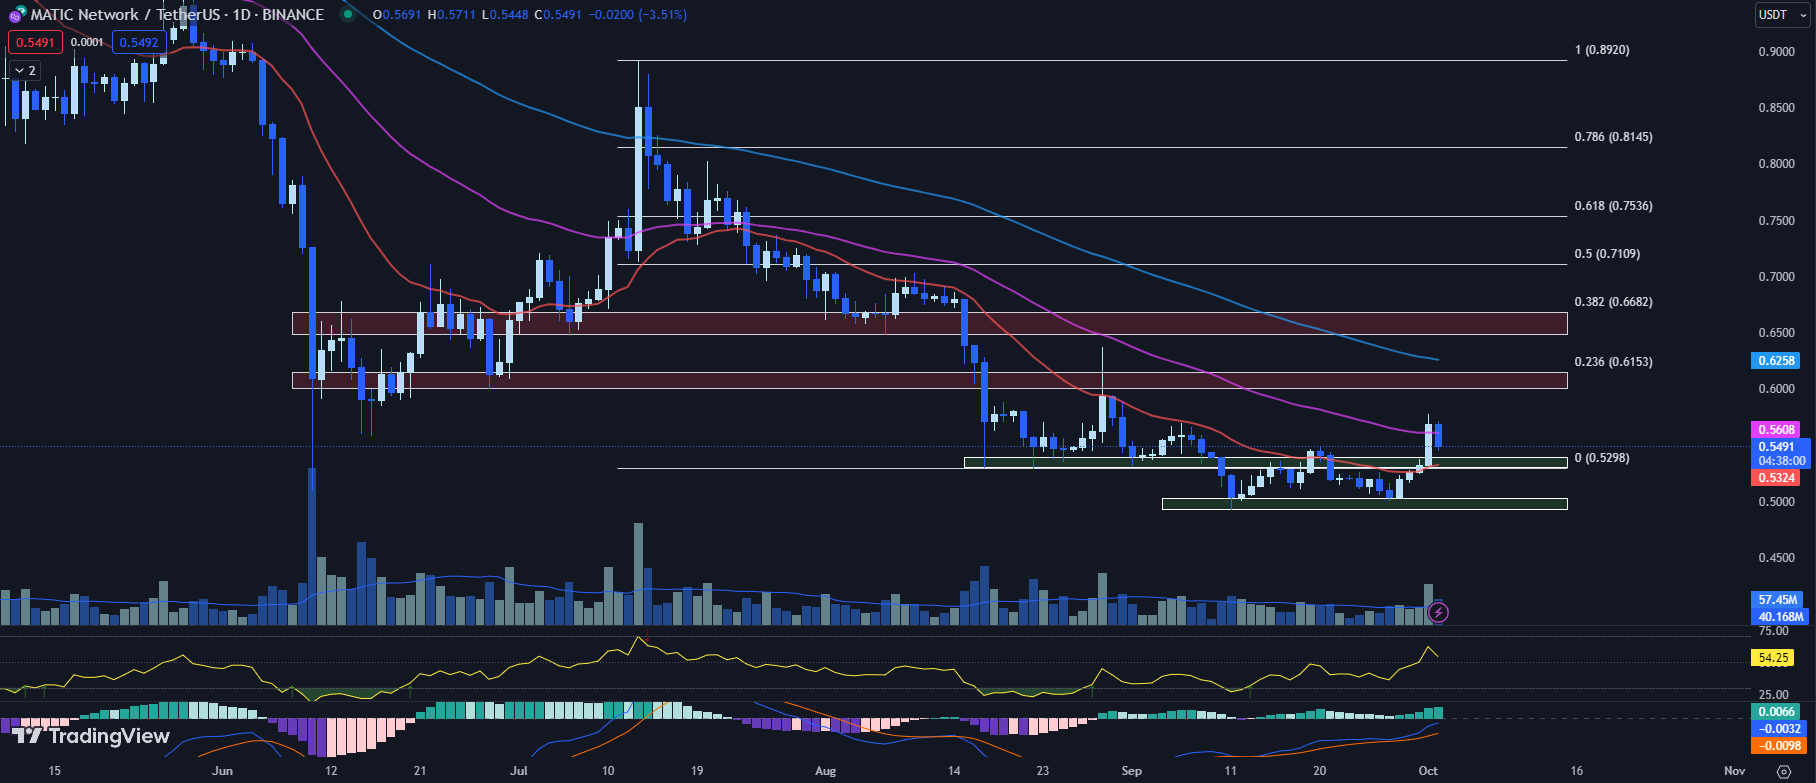
After posting gains for four consecutive days, the MATIC price faced a reversal on Monday, with prices dropping 3.51% so far today amidst declining momentum.
With MATIC hovering precariously near a crucial support zone, traders are questioning if this is a bottom or if there is further downside ahead for the cryptocurrency.
The 20-day EMA for the MATIC price currently stands at $0.5324, while the 50-day EMA sits at $0.5608. Typically, when the short-term EMA is above the long-term EMA, it signals bullish momentum.
However, with the MATIC price beginning to trade below the 50-day EMA, it suggests growing weakness and potential for further declines.
The RSI has fallen to 54.25, down from yesterday's 62.04. While not yet oversold, the drop towards the 50 level warns of fading upside traction. If the RSI continues lower, it could foreshadow additional MATIC price erosion.
The MACD histogram has ticked slightly higher to 0.0066, up from 0.0063 yesterday. But with the indicator still near the zero line, it underscores the lack of clear directional bias.
With the MATIC price pulling back from its 50-day EMA, it now looks to find support near its previous range of $0.5302 to $0.5394. This area aligns closely with the 20-day EMA at $0.5324, making it a level to watch.
Failure to hold above this support zone could open the door for a steeper decline toward the $0.4250 price level. Therefore, traders may look to lock in profits on any bounces lower.
Conversely, a move back above the 50-day EMA at $0.5608 would negate the short-term bearish outlook. This could pave the way to retest horizontal resistance around $0.6000.
The MATIC price is at an inflection point, stabilizing above a key support confluence. While overbought readings may fuel a bounce, volume trends remain lackluster. As a result, trading within defined risk limits is recommended until MATIC can stage a decisive breakout.
 cryptonews.com
