The cryptocurrency market started this month on a positive note. October, which has historically been a bullish month for the cryptocurrency market, seems to be maintaining its reputation as a positive period for the market. This is evident in the fact that the total cryptocurrency market cap increased 2.49% over the past 24 hours, according to CoinMarketCap data.
Following this marketwide uptick, traders and investors may want to pay close attention to Chainlink (LINK), Bitcoin (BTC), Ethereum (ETH), and Dogecoin (DOGE). At press time, all 4 of these cryptocurrencies were in the process of challenging either key support or major resistance levels.
Bitcoin (BTC)
The market leader was able to overcome a strong resistance level over the past 24 hours. Furthermore, one noteworthy technical flag that was on the verge of being triggered suggested that BTC’s price could continue to rise in the medium term.
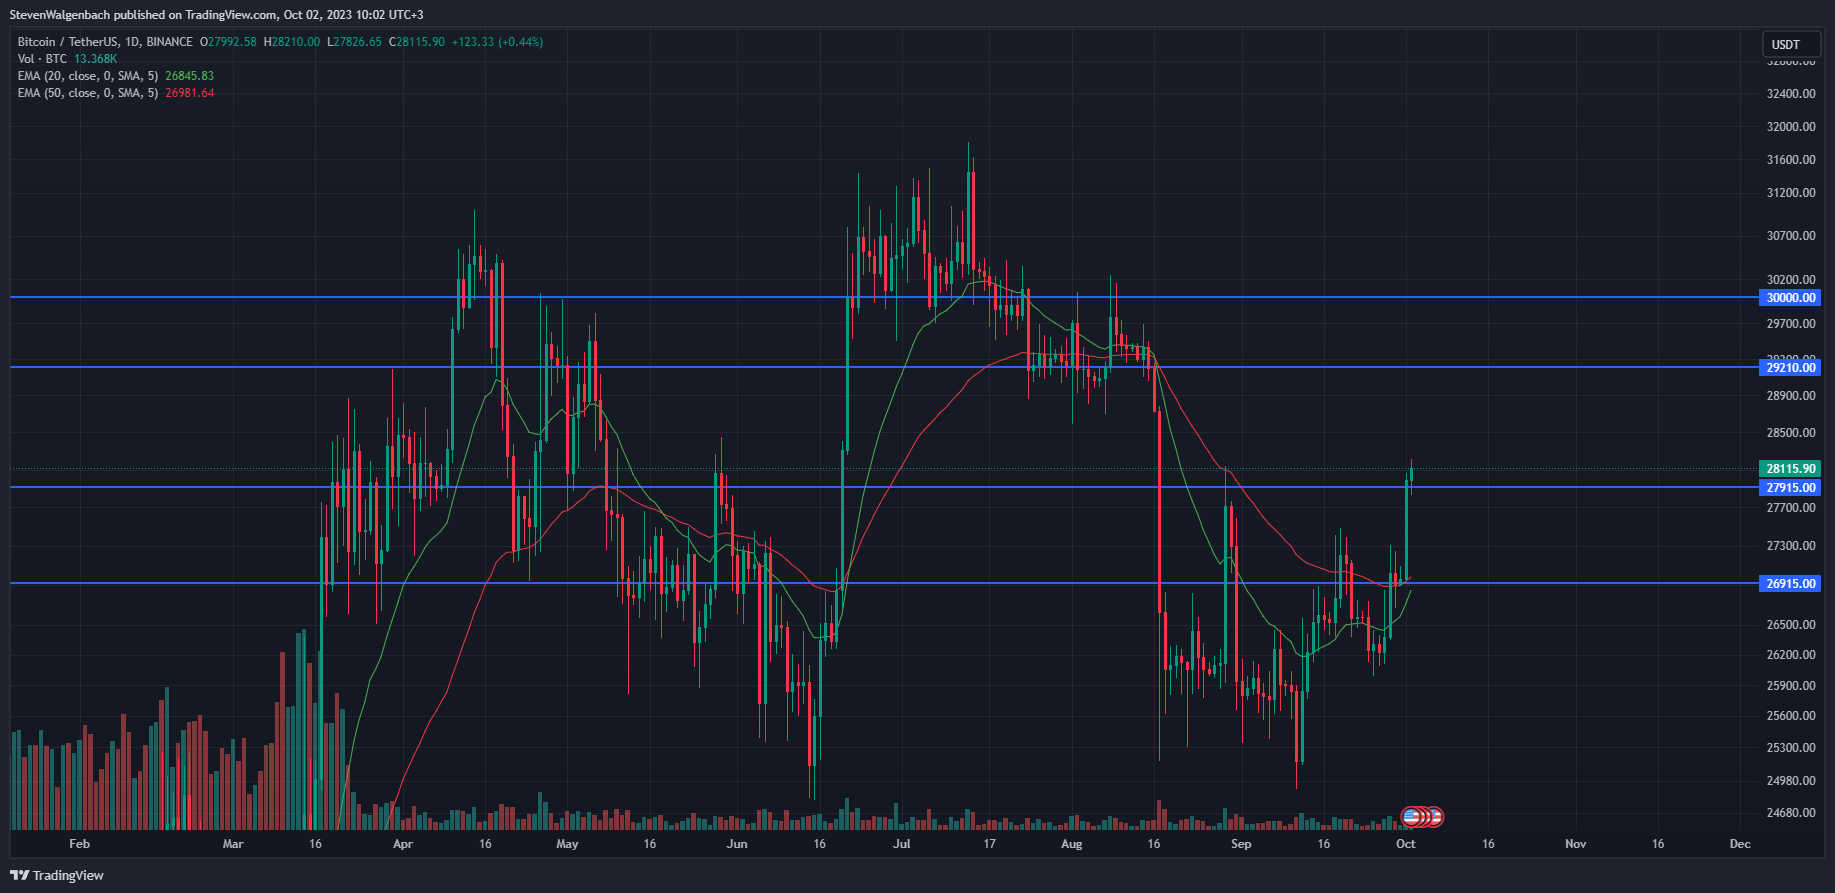
BTC’s price broke above the $27,915 barrier during the past day of trading and continued to trade above this significant mark at press time. Should the cryptocurrency close today’s daily candle above this price point, it may have the foundation needed to continue climbing. If this bullish thesis is validated, BTC could rise to as high as $29,210.
Thereafter, continued buy pressure may boost the leading cryptocurrency’s price to above the $29,210 resistance level before potentially elevating BTC to the psychological $30K mark. On the other hand, this bullish thesis may be invalidated if BTC falls below $27,915 within the next 48 hours.
BTC losing the support of this key mark may open up the risk of BTC retracing down to $26,915 in the following week. Investors and traders will want to note that a significant bullish technical flag was on the cusp of being triggered – suggesting that a bullish scenario could be more likely to play out.
At press time, the 20-day EMA line was looking to cross above the 50-day EMA line. This was after BTC’s momentum over the past 20 days was more bullish than that recorded throughout the previous 50 days. Subsequently, these two technical indicators crossing could be an indication of the market leader’s medium-term trend shifting in favor of bulls.
Ethereum (ETH)
ETH was attempting a challenge at a key resistance level at press time. This was after a bullish short-term technical flag was triggered on the altcoin leader’s daily chart during the past week.
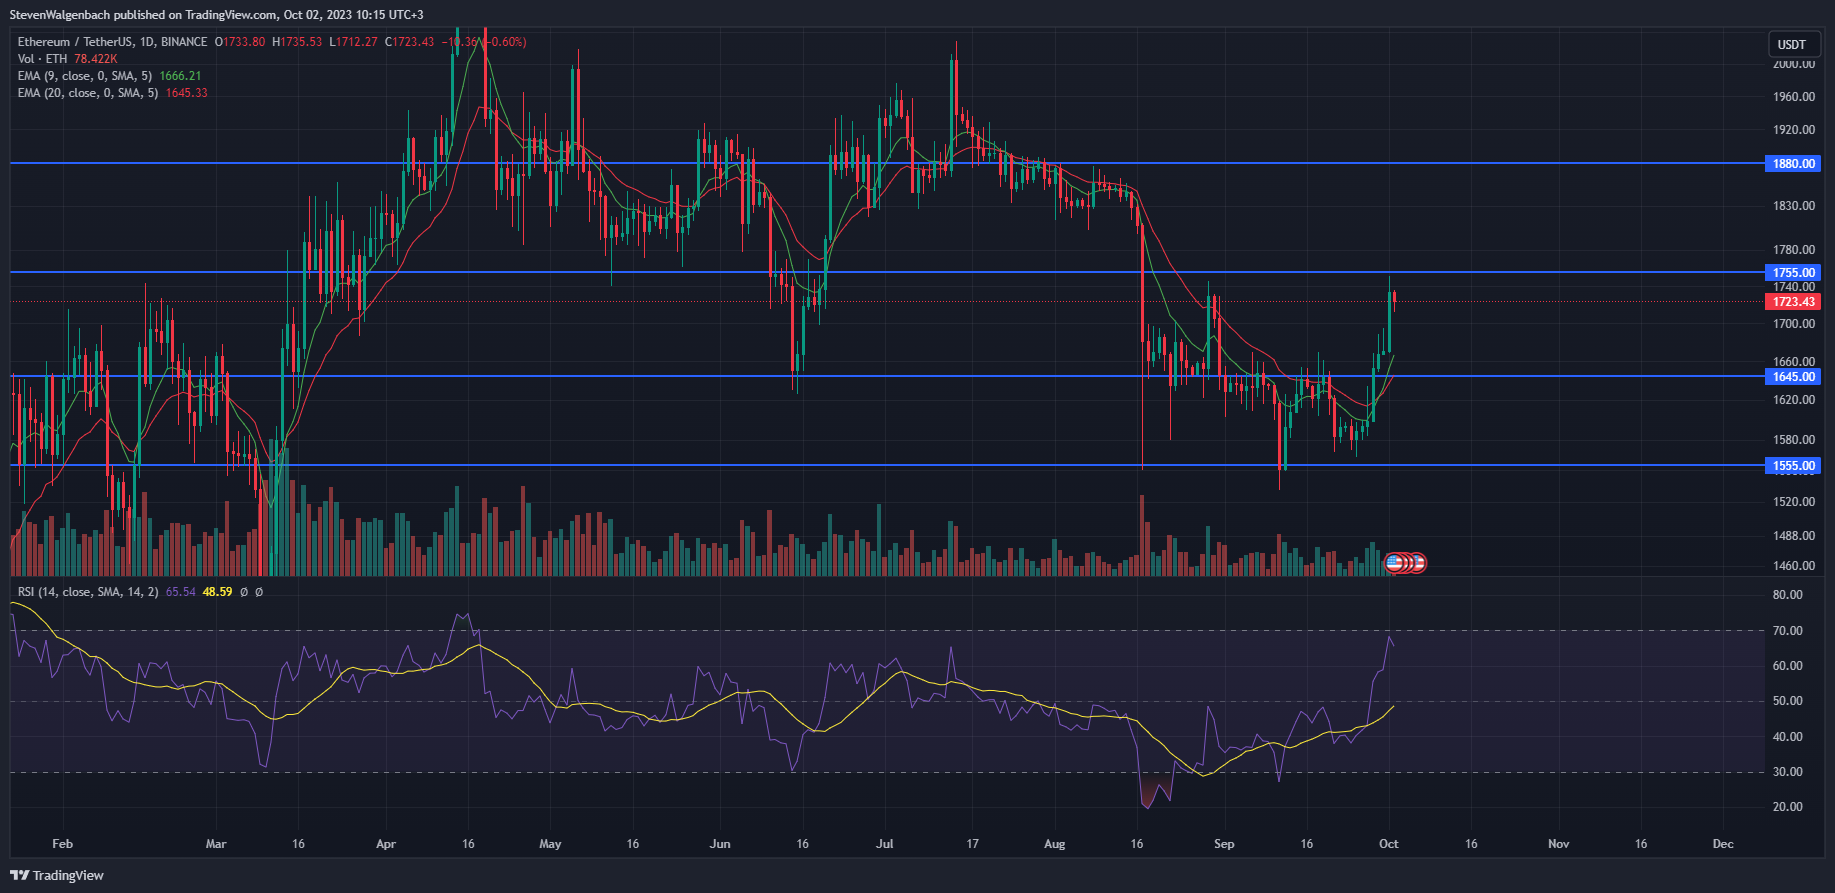
On 28 September 2023, the 9 EMA line crossed above the 20 EMA line on the altcoin’s daily chart. This suggested that short-term momentum had shifted in favor of bulls. Since then, the technical flag was validated – resulting in ETH’s price flipping the resistance level of $1,645 into support in the following 48 hours.
This bullish momentum continued to elevate ETH’s value to the subsequent resistance level of $1,755 at press time. Sellers had defended the level yesterday, however, leading to a slight retracement in the altcoin’s price. As a result, ETH’s price was at risk of pulling back to the aforementioned $1,645 mark in the coming week.
If ETH does pull back to this immediate support level, then it could also drop below the mark to the next key level at $1,555 if bears persist. Conversely, a daily candle close above $1,755 may invalidate this bearish thesis. ETH breaking above $1,755 could give it the foundation needed to rise to $1,880 in the following 7 days.
A technical indicator to keep an eye on is the daily RSI. At press time, the RSI line was in overbought territory. Furthermore, its gradient had turned negative. This suggested that buyers’ strength had diminished somewhat. Consequently, a bearish scenario may be more likely to play out in the next few days – resulting in ETH’s price falling.
Chainlink (LINK)
LINK was able to overcome a major resistance level over the past 3 days. However, this achievement may be short-lived given the fact that bulls seemed to be losing their strength.
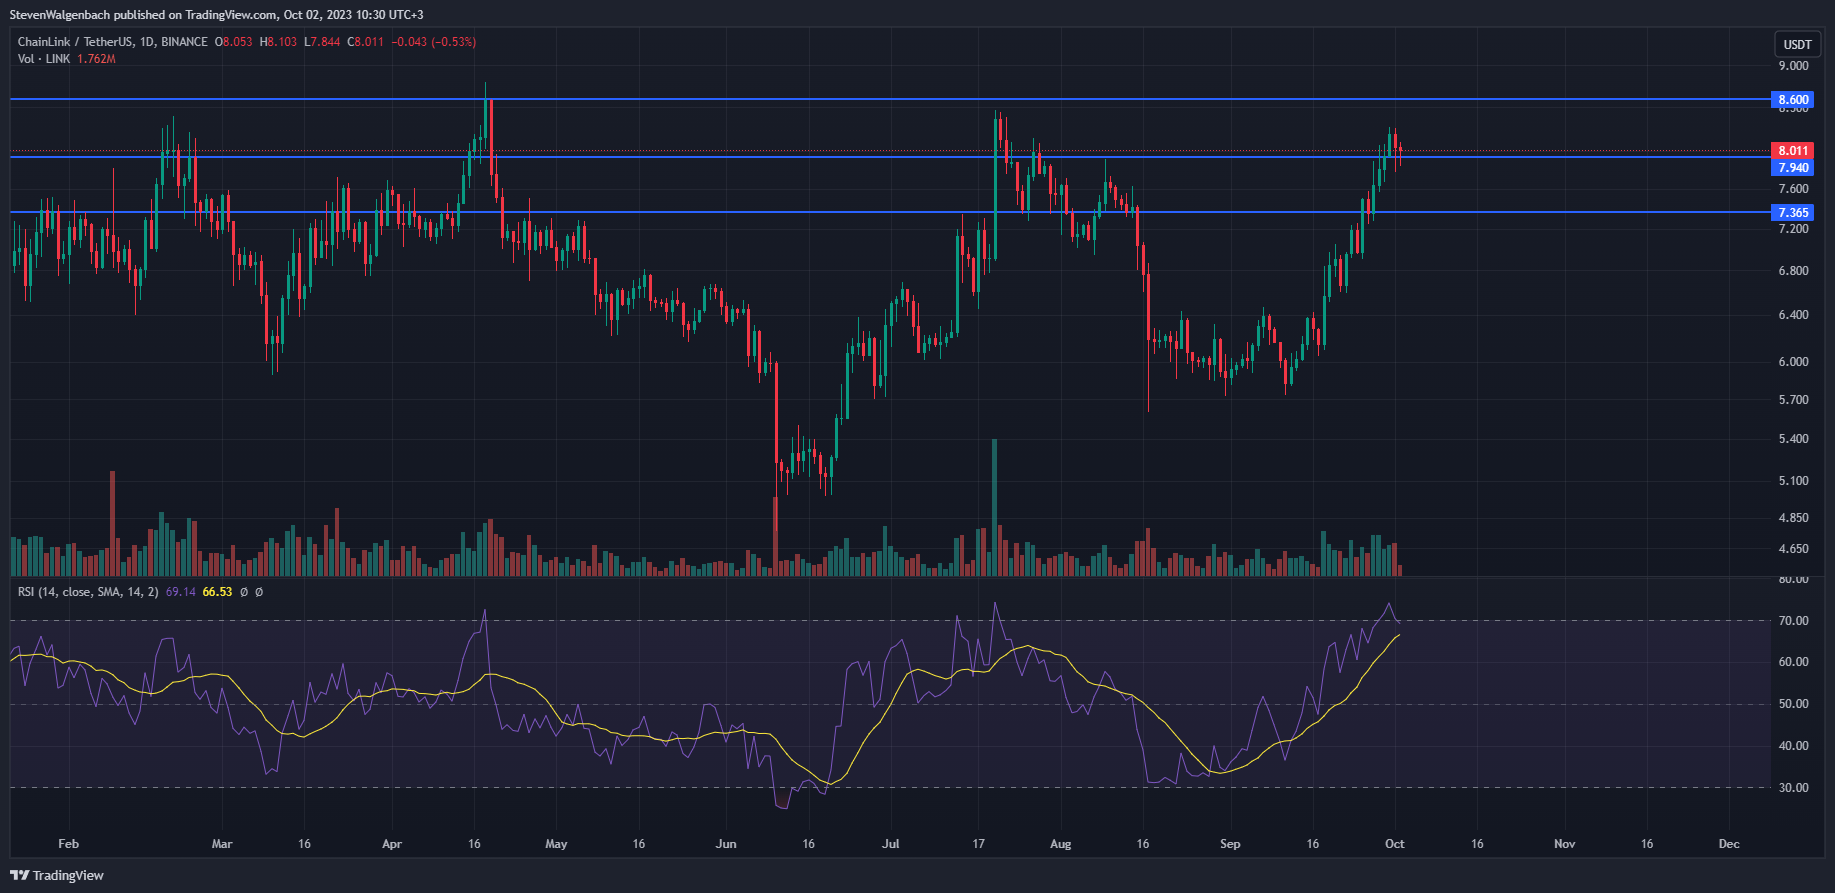
At press time, LINK was trading above the $7.940 barrier after it breached the level on Saturday. During today’s trading session, however, the altcoin’s price had dropped back below this mark – suggesting that sellers may be attempting to force LINK back below the significant price point.
Should bears succeed in their quest to close today’s trading session below $7.940, LINK could be at risk of dropping to the subsequent support level of $7.365. Conversely, if bulls are able to counteract the current sell pressure that has entered LINK’s daily chart, then the cryptocurrency could resume its ascent to potentially climb to as high as $8.60.
A bearish scenario may be more likely to play out given the fact that the daily RSI line was closing in on the daily RSI SMA line. This suggested that buyers were losing their strength. Subsequently, if these two lines cross in the coming few days, it will trigger a noteworthy bearish technical flag that could indicate that sellers have gained the upper hand on LINK’s charts.
Dogecoin (DOGE)
DOGE had been stuck in a consolidation channel for the past 3 weeks. Despite this, the meme coin’s price may finally be attempting to break out above this sideways price channel.
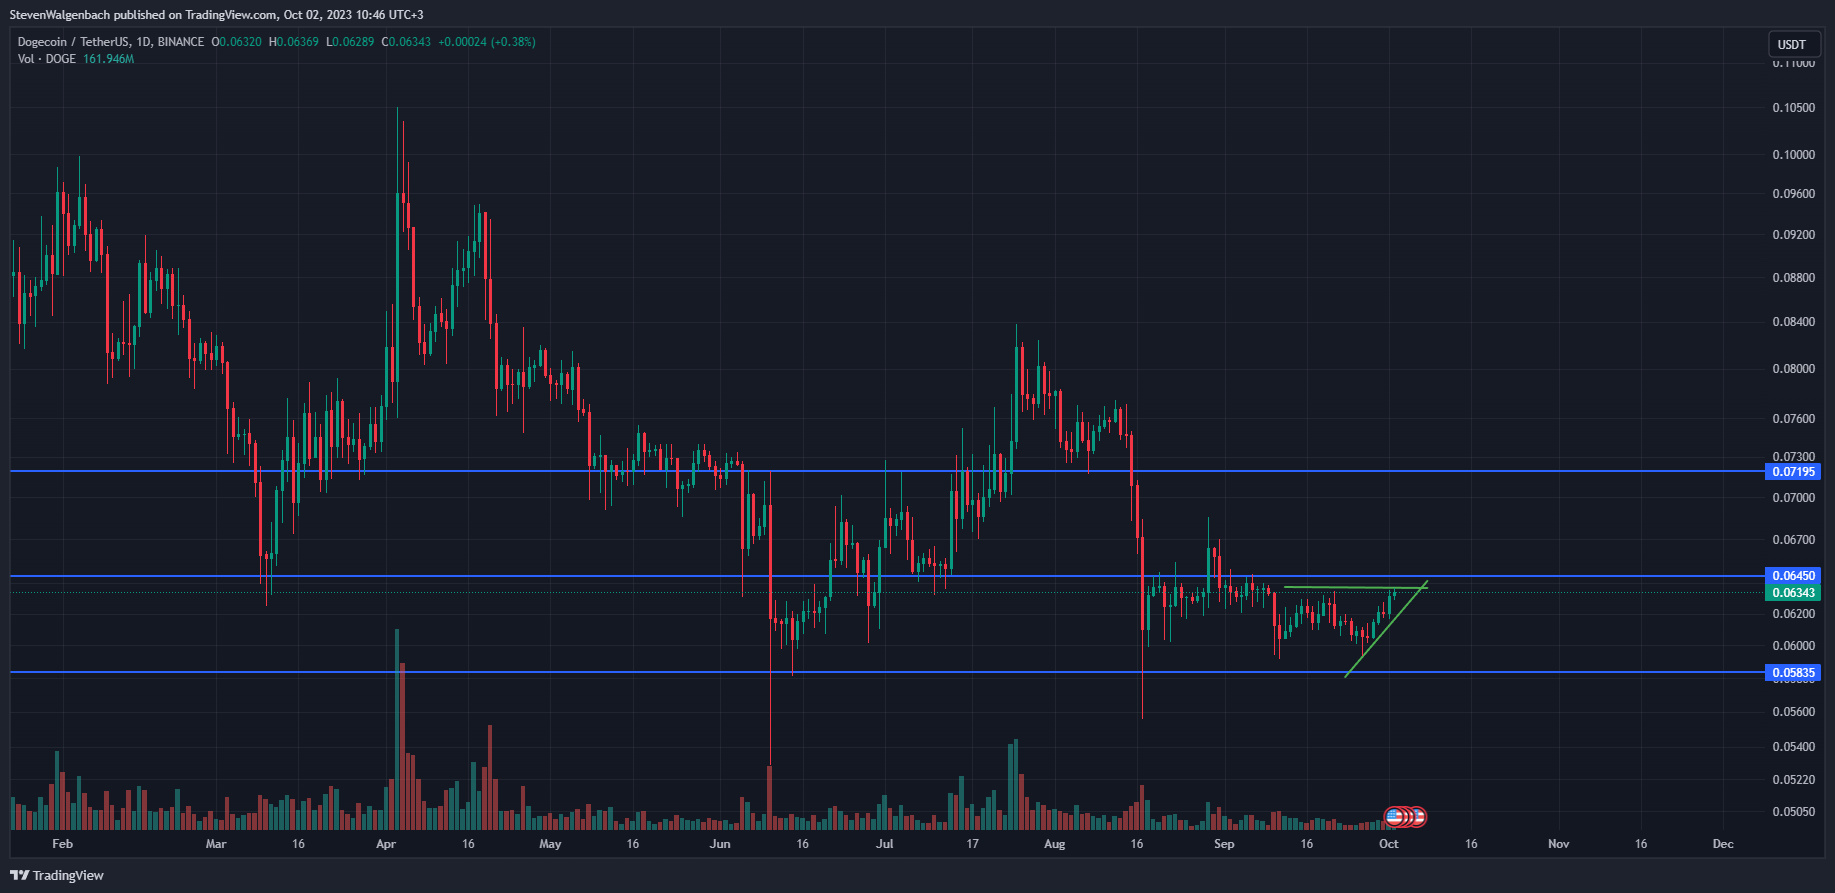
An ascending triangle pattern had formed on DOGE’s daily chart after the altcoin’s price printed a series of higher lows over the past couple of days. If this pattern is validated, the altcoin could breach the next resistance level at $0.0450 in the following 24-48 hours. Thereafter, traders could identify a break above this price point as a buying opportunity.
Subsequently, DOGE’s value could rise to as high as the next barrier at $0.07195 through the course of the proceeding 7 days. On the other hand, if DOGE is unable to close a daily candle above $0.06450 within the upcoming 48 hours, then its price may drop to the $0.05835 support level.
Disclaimer: The views and opinions, as well as all the information shared in this price analysis, are published in good faith. Readers must do their own research and due diligence. Any action taken by the reader is strictly at their own risk. Coin Edition and its affiliates will not be held liable for any direct or indirect damage or loss.