NEXO coin price struggles to rise within the broadening channel as bearishness increases. Will the lack of demand result in a fallout?
Nexo is a blockchain-based lending platform that offers users instant cryptocurrency-backed loans. To receive a loan, users must deposit a token such as Bitcoin, Ether, Litecoin as collateral.
The largest regulated institution for digital assets announced that its Board of Directors approved a $100 Million buyback program. This allows the company to repurchase its native NEXO Token on the open market at its discretion.
Past Performance of NEXO
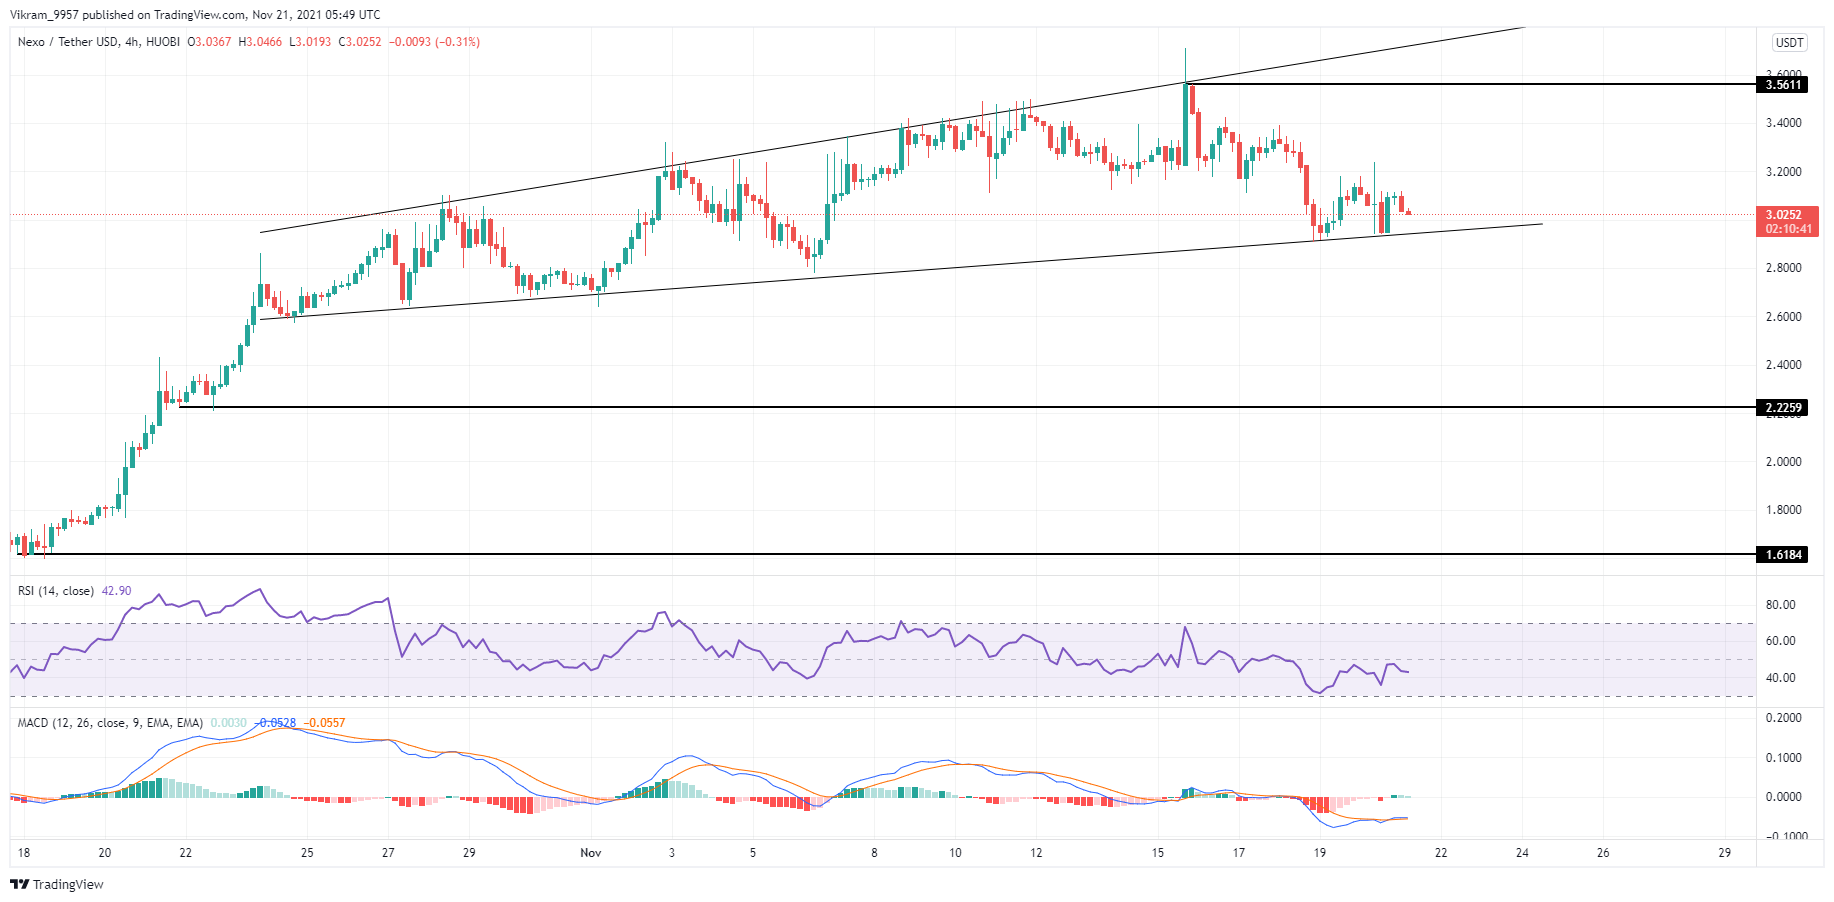
The NEXO coin price jumps higher with increased momentum after the bullish breakout of a consolidation range in the 4-hour chart. Thus, resulting in the formation of multiple bullish candles.

NEXO/USD Daily Chart
NEXO Technical Analysis
The token buyback program will begin immediately and, depending on market conditions, it is expected to be completed in six months. After that, the Board of Directors could decide to make a subsequent buyback.
The buyback program ideally should have increased the demand in the coin price. However, the chart shows minimal upside move within the ascending broadening pattern.
The RSI indicator projects the slope failing to rise above the 50% line in the 4-hour chart despite multiple attempts. The slope is in the ‘nearly oversold’ zone as it falls lowers. Hence, the RSI indicates a rise in bearishness in the NEXO coin.
The MACD indicator shows the increasing intensity of the bearish histograms in the 4-hour chart. Moreover, the fast and slow lines are intermingled below the zero line. Hence, the indicator gives a sell signal.
Upcoming Trend
Nexo claims to be a blockchain platform designed for the new internet economy and decentralized applications. Its key selling point is its high scaling ability. According to Nexo, it is the only blockchain network where state, network, and transaction sharding can all be implemented.
The technical indicators project an increase in underlying bearishness along with the price action in the 4-hour chart. Hence, traders can shortly observe the price breaks below the support trend line.
Upon the support trend line fallout, the next support levels are at $2.22 and $1.60 marks.
 cryptoknowmics.com