
Tron price is gaining pace above $0.0850 against the US Dollar. $TRX is outperforming Bitcoin and could rise further toward $0.092.
- Tron is moving higher above the $0.0850 resistance level against the US dollar.
- The price is trading above $0.0862 and the 100 simple moving average (4 hours).
- There is a major bullish trend line forming with support near $0.0855 on the 4-hour chart of the $TRX/USD pair (data source from Kraken).
- The pair could continue to climb higher toward $0.092 or even $0.095.
Tron Price Regains Strength
In the last Tron price analysis, we discussed the chances of more gains in $TRX against the US Dollar. $TRX remained stable, outperformed Bitcoin, and traded above the $0.082 resistance level.
The bulls were able to pump the price above the $0.0825 and $0.0850 resistance levels. A high was formed near $0.0879 and the price is currently consolidating gains. The current price action suggests that the price could climb further higher above $0.088.
It is now trading well above the 23.6% Fib retracement level of the upward move from the $0.0820 swing low to the $0.0879 high. $TRX is also trading above $0.0865 and the 100 simple moving average (4 hours). There is also a major bullish trend line forming with support near $0.0855 on the 4-hour chart of the $TRX/USD pair.
On the upside, an initial resistance is near the $0.088 level. The first major resistance is near $0.0920, above which the price could accelerate higher. The next resistance is near $0.095.
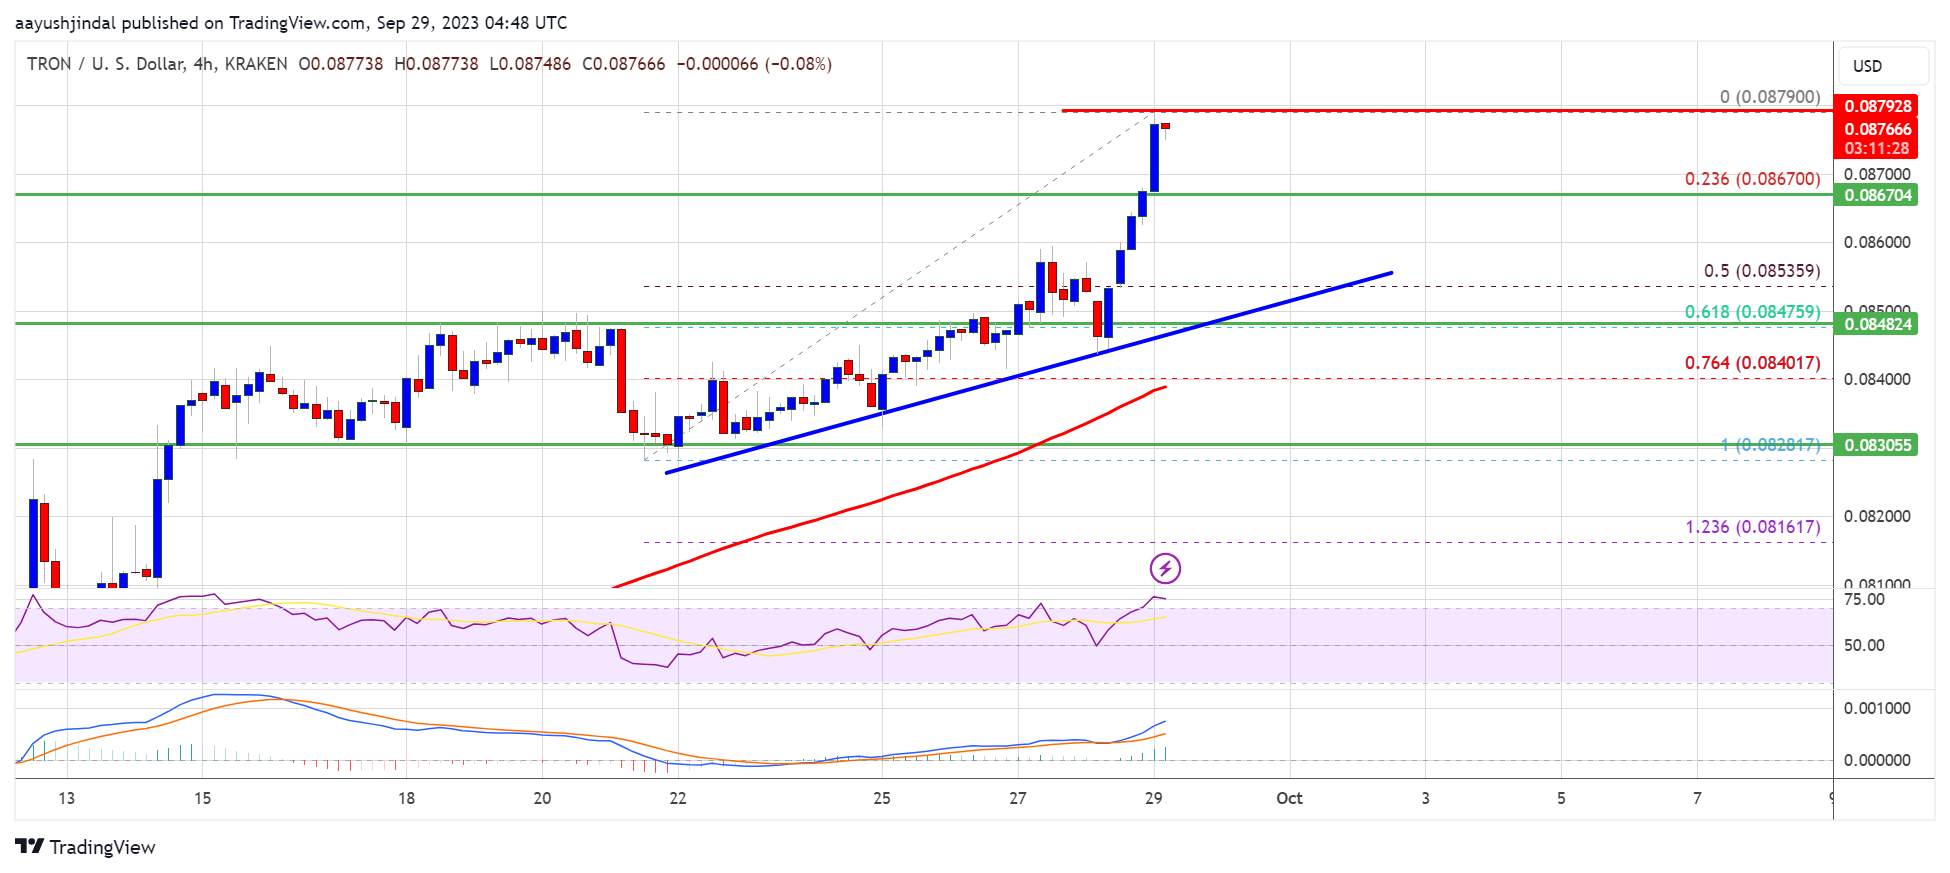
Source: TRXUSD on TradingView.com
A close above the $0.095 resistance might send $TRX further higher toward $0.10. The next major resistance is near the $0.105 level, above which the bulls are likely to aim for a larger increase toward $0.112.
Are Dips Limited in $TRX?
If $TRX price fails to clear the $0.088 resistance, it could start a downside correction. Initial support on the downside is near the $0.0867 zone. The first major support is near the $0.0855 level or the trend line.
The trend line is near the 50% Fib retracement level of the upward move from the $0.0820 swing low to the $0.0879 high, below which it could test the 100 simple moving average (4 hours). The next major support is $0.0830.
Technical Indicators
4 hours MACD – The MACD for $TRX/USD is gaining momentum in the bullish zone.
4 hours RSI (Relative Strength Index) – The RSI for $TRX/USD is currently above the 50 level.
Major Support Levels – $0.0867, $0.0855, and $0.0830.
Major Resistance Levels – $0.0880, $0.0920, and $0.0950.