The asset management firm VanEck announced on Thursday that it plans to launch an exchange-traded fund (ETF) based on Ethereum futures contracts in the near future.
The VanEck Ethereum Strategy ETF (EFUT) will invest in cash-settled futures contracts for ether, the native cryptocurrency of the Ethereum blockchain network.
Amidst these current cryptocurrency ETF developments, what is the best crypto to buy now?
According to VanEck's press release, EFUT shares will be listed for trading on the Chicago Board Options Exchange (CBOE), though a specific start date has not yet been revealed.
Bloomberg ETF analysts have predicted the new Ethereum futures ETF could begin trading as early as October 2nd or 3rd, pending regulatory approval from the Securities and Exchange Commission (SEC). VanEck stated that the fund's shares cannot be sold until its SEC registration is effective.
This will be the first Ethereum futures ETF available to U.S. investors, following the launches of several Bitcoin futures ETFs in 2021.
Despite numerous proposals for Bitcoin and Ethereum spot ETFs, the U.S. market is yet to see these offerings due to the SEC's consistent deferrals on these decisions.
VanEck has sought for years to bring cryptocurrency ETFs to U.S. investors but faced hurdles from the SEC. The firm's Bitcoin futures ETF launched in November 2021 but has seen relatively muted demand compared to competitors like ProShares' Bitcoin futures ETF.
With its planned Ethereum product, VanEck seeks to capitalize on the surging interest in Ethereum investment vehicles. The company is among over a dozen firms with Ethereum futures ETF proposals recently filed with the SEC.
With this latest update, Ethereum's price has seen bullish momentum in trading, pushing past its 20-day exponential moving average to trade at about $1,660, a rise of roughly 4% so far today.
Bitcoin and the total cryptocurrency market capitalization likewise trended upward, gaining 2.98% and 2.62% respectively.
Considering the upbeat movement in today's cryptocurrency market, other altcoins such as Biconomy, Bitcoin Minetrix, Compound, Meme Kombat, and LeverFi are staking their claim as potential choices for the best crypto to buy now given their solid fundamentals and/or bullish chart patterns.
BICONOMY's BICO Token Soars 40% as Eden Block Claims over 1.5 Million Tokens
Biconomy's native BICO token is jumping over 40% so far today after major BICO backer Eden Block claimed over 1.5 million tokens worth around $417,000 from a vesting wallet contract.
According to on-chain data analytics provider LookOnChain, venture capital firm Eden Block claimed the BICO tokens from a vesting wallet.
Diverging from past instances where Eden Block added new BICO tokens to its staking balance, this time the venture capital firm claimed 210,717 BICO valued at roughly $56,000 as yield from its existing staked tokens.
Eden Block's move has fueled conjecture among certain cryptocurrency market experts that the VC firm may opt to sell off part or all of its newly claimed BICO, considering the token's significant price increase lately. The token has risen nearly 40% in the last month amid momentum across the crypto markets.
Some are drawing parallels to FTX, where Alameda Research had previously collected staking rewards shortly before offloading large FTT token positions. These observers view Eden Block's BICO claim in a similar vein - as a possible harbinger of the VC firm cashing out gains on its holdings.
Market experts are questioning whether BICO's rapid price increase is justified by Biconomy's current fundamentals, or whether the token has become overheated. They argue further pullbacks in BICO's price would not be surprising if major holders sell down portions of their positions.
BICO Price Prediction: Momentum Surge or Temporary Uptick?
 BICO price 09-28-23" sizes="100vw">
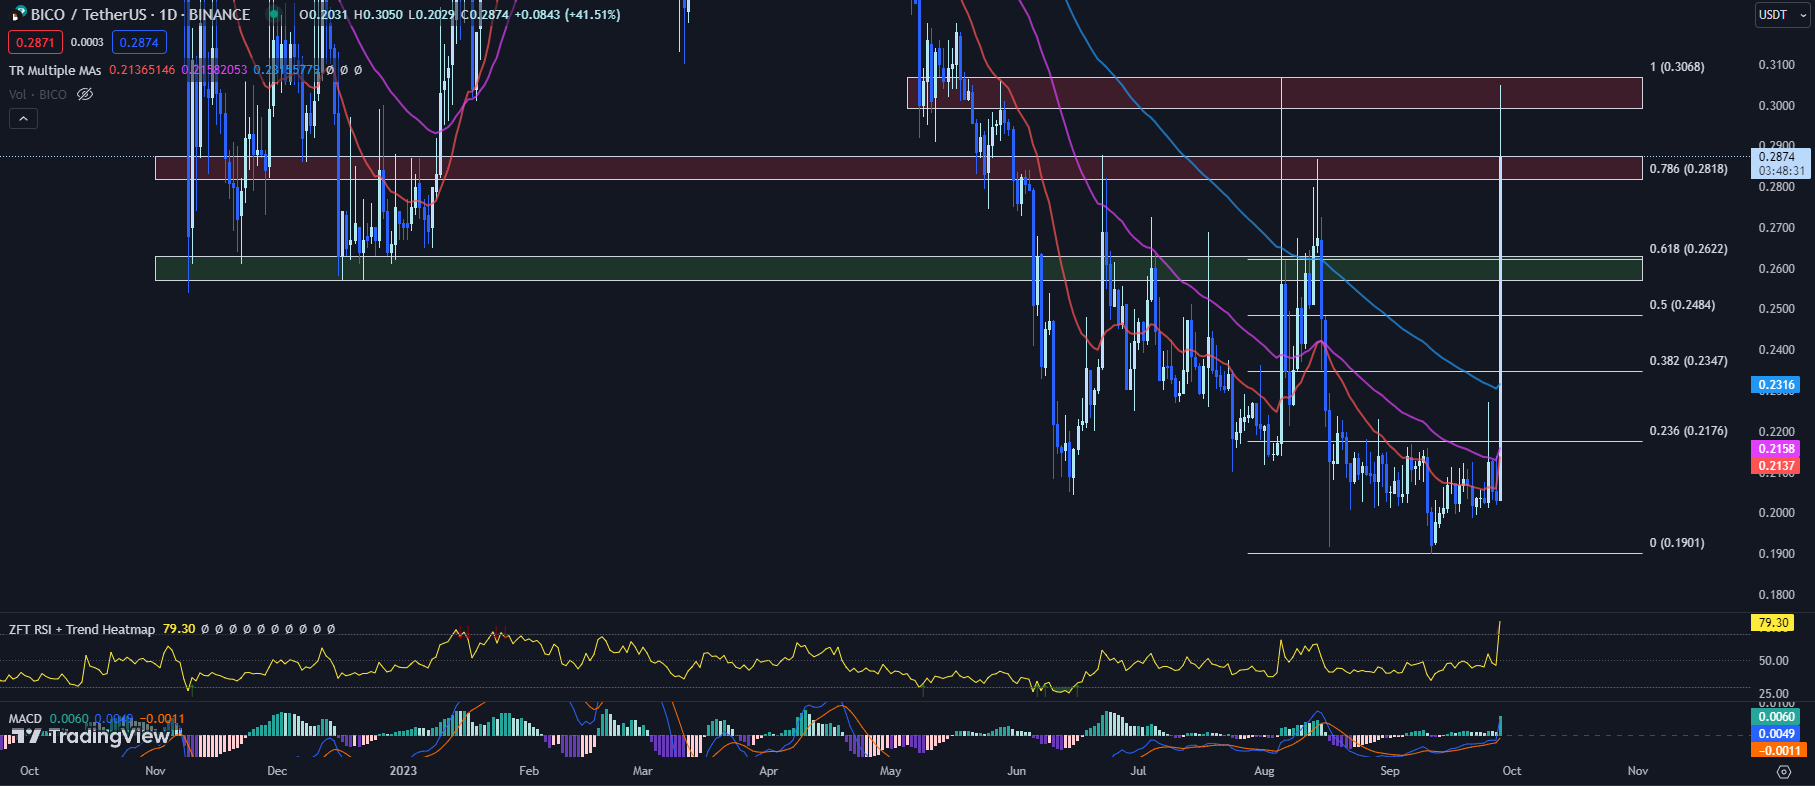
Following a 42-day consolidation below the Fib 0.236 level of $0.2176, Biconomy (BICO) has experienced an increased trading activity, driven by the Eden Block token acquisition news. Can BICO sustain this upward momentum, or is it merely a short-lived spike?
The BICO price has seen a sharp 41.51% increase so far today, with the current price standing at $0.2874. The 20-day EMA for BICO price is currently at $0.2137, slightly below the 50-day EMA of $0.2158 and the 100-day EMA of $0.2316.
This suggests a strong bullish trend, with the short-term EMA crossing above the long-term EMA, but investors should remain vigilant, observing other technical indicators to corroborate these signals.
The RSI for BICO price has surged to 79.30 from yesterday's 46.15, indicating that the market is currently in an overbought condition. This suggests that the recent price increase may slow down or even reverse, as overbought conditions often precede price corrections.
The MACD histogram has climbed to 0.0060 from yesterday's 0.0008, further reinforcing the strong bullish sentiment in the BICO market. This growth in positive values could potentially propel the BICO price further, as it indicates a gain in upward momentum.
The market cap has seen a significant rise of 39.17% to $186.3 million, and the 24-hour trading volume has skyrocketed by 2425.85% to $59.2 million. This sharp increase in trading volume and market cap suggests a heightened investor interest in BICO, which could potentially drive the BICO price further up.
The immediate resistance for the BICO price is the current resistance zone of $0.2818 to $0.2876, in line with the Fib 0.786 level of $0.2818. If BICO manages to close above this area, the next potential resistance lies between $0.2992 to $0.3069, which was retested earlier today when BICO hit an intraday high of $0.3050.
On the flip side, the immediate support level is the horizontal support zone of $0.2572 to $0.2630, in confluence with the Fib 0.618 level of $0.2622.
While the BICO price has shown a strong bullish trend, traders should keep a close eye on the overbought conditions indicated by the RSI. A consolidation or correction might be on the horizon.
An intelligent approach would be to prepare for both scenarios – a continuation of the uptrend and a potential price correction.
Stake-to-Mine: The Affordable Path to Bitcoin Mining with Bitcoin Minetrix
Bitcoin Minetrix offers a revolutionary new way for crypto investors and traders to profit from Bitcoin mining without breaking the bank.
The project's "stake-to-mine" model creates bitcoin rewards from staking tokens for as little as a $10 buy-in, avoiding pitfalls of past cloud mining scams.
According to the project’s website, users can purchase BTCMTX tokens and stake them to generate “Cloud Mining Credits,” a separate token they can redeem for Bitcoin mining power.
This effectively lets token holders tap into bitcoin mining profits by pooling their staked assets, without needing to purchase expensive equipment or pay massive electricity bills.
Bitcoin mining has largely been the domain of large companies that can afford the latest specialized computers and cover the huge energy costs.
With the price of bitcoin recently around $27,000, the estimated cost to mine one bitcoin is $42,000 - presenting a prohibitively high barrier to entry for individual miners.
Bitcoin Minetrix intends to break down those barriers by letting anyone access Bitcoin mining profits for minimal upfront investment through its decentralized, tokenized platform.
The project highlights that previous cloud mining schemes have been plagued with scams, lack of transparency, and hidden fees, problems its model seeks to resolve.
The presale has a soft cap target of $15.6 million in funds raised. To participate, users can purchase ETH, USDT, or BNB, which are accepted currencies for buying BTCMTX tokens.
BTCMTX tokens purchased during the presale can also be staked to generate substantial yields upwards of 60,000% APY, adding further incentive to buy in early.
Getting started only requires interested users to set up a Web3 wallet like MetaMask and purchase $10 or more worth of ETH, BNB, or USDT. That provides the minimum buy-in to acquire BTCMTX tokens and begin staking them to earn Bitcoin mining profits.
Visit Bitcoin Minetrix Now
COMP Price Surges by 17.91%: Is Bullish Momentum Here to Stay?
 COMP price 09-28-23" sizes="100vw">
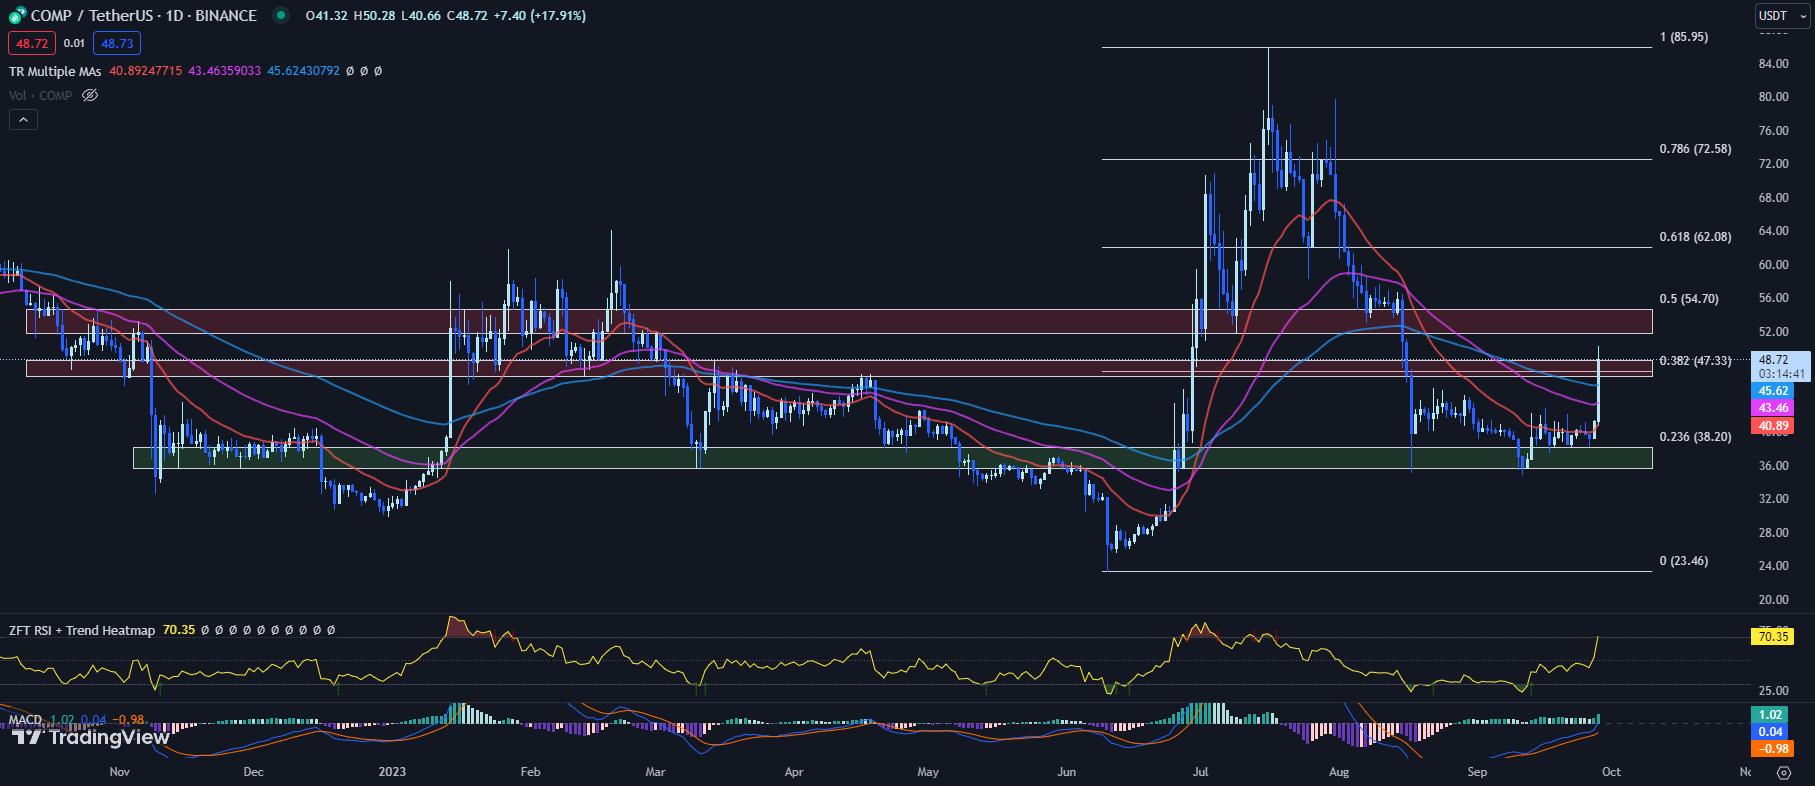
Also emerging from a 42-day consolidation period, the COMP price is seeing a significant upsurge in trading activity, with an impressive 17.91% rise so far today, trading at $48.72.
A surge in trading volume usually indicates heightened investor interest, which could provide the necessary momentum for further price appreciation.
The technical indicators for the COMP price reveal a very intriguing picture. Currently, the 20-day EMA stands at $40.89, beneath the 50-day EMA of $43.46.
In contrast, the 100-day EMA mirrors the 20-day EMA at $40.89. This suggests that despite the recent price increase, the long-term momentum has not yet shifted into bullish territory.
The RSI has shot up to 70.35 from yesterday's 52.58. An RSI above 70 typically indicates overbought conditions. However, this could also signify robust bullish momentum for the COMP price, particularly if sustained over time.
Traders should keep a close eye on this indicator to see if it maintains these high levels or starts to decline, signaling a potential price pullback.
The MACD histogram has nearly doubled to 1.02 from yesterday's 0.52. This sharp increase indicates a growing bullish momentum, which could potentially drive the COMP price higher in the immediate future.
In terms of key price levels, the COMP price is currently challenging a significant resistance zone ranging from $46.70 to $48.56. This resistance zone aligns with the Fib 0.382 level of $47.33.
If the COMP price can decisively break and hold above this level, it could signal the start of a new bullish trend, attracting more buyers into the market.
Conversely, immediate support can be found at the 100-day EMA of $40.89, followed by the 50-day EMA of $43.46. If the COMP price fails to maintain its current bullish momentum and falls below these levels, it could indicate a shift to bearish sentiment, potentially leading to further price declines.
While the COMP price has seen a significant increase in the short term, the technical indicators present a mixture of signals.
The overbought RSI and growing MACD suggest strong bullish momentum, while the EMAs indicate that long-term momentum has not yet swung in the bulls' favor.
Traders should carefully monitor these technical indicators and key price levels, and adjust their strategies accordingly.
Meme Kombat: The Best Crypto to Buy Now for Memes and Gaming Enthusiasts
The cryptocurrency ecosystem has seen the rise of numerous meme-inspired projects in recent years, tapping into the viral nature of internet humor and culture.
The latest to generate intrigue is Meme Kombat, a crypto gaming platform focused on battles between characters represented by popular memes.
With its launch on the horizon, Meme Kombat seeks to attract enthusiasts through a presale of its native $MK token.
According to the project’s whitepaper, Meme Kombat looks to build a gaming ecosystem centered on meme battles occurring within an AI-powered arena.
These fights are fueled by the $MK currency, which holders can also stake to earn passive income. The platform currently advertises a 112% APY staking reward.
Meme Kombat’s development has drawn coverage from crypto outlets like Cointelegraph amid anticipation in the community.
The project has implemented a transparent structure, capping the total token supply and allocating portions to staking, rewards, liquidity, and the upcoming presale.
The presale itself holds a $1 million soft cap and a $10 million hard cap as Meme Kombat works toward its full launch goal for late 2023.
Founder Matt Whiteman lends credibility through his industry background, contrasting the frequent anonymity of meme coin developers.
By combining viral meme culture with crypto gaming, Meme Kombat seeks to attract engaged participants leading up to its launch.
With intrigue already growing around the meme-themed crypto project, the presale offers enthusiasts the first chance to gain exposure to one of the best crypto to buy now.
LeverFi (LEVER) Defies Market Slump With Impressive 62.87% Monthly Increase So Far

Despite a sluggish performance in the broader cryptocurrency market throughout September, LeverFi (LEVER) has bucked the trend with an impressive 62.87% increase on the monthly candle.
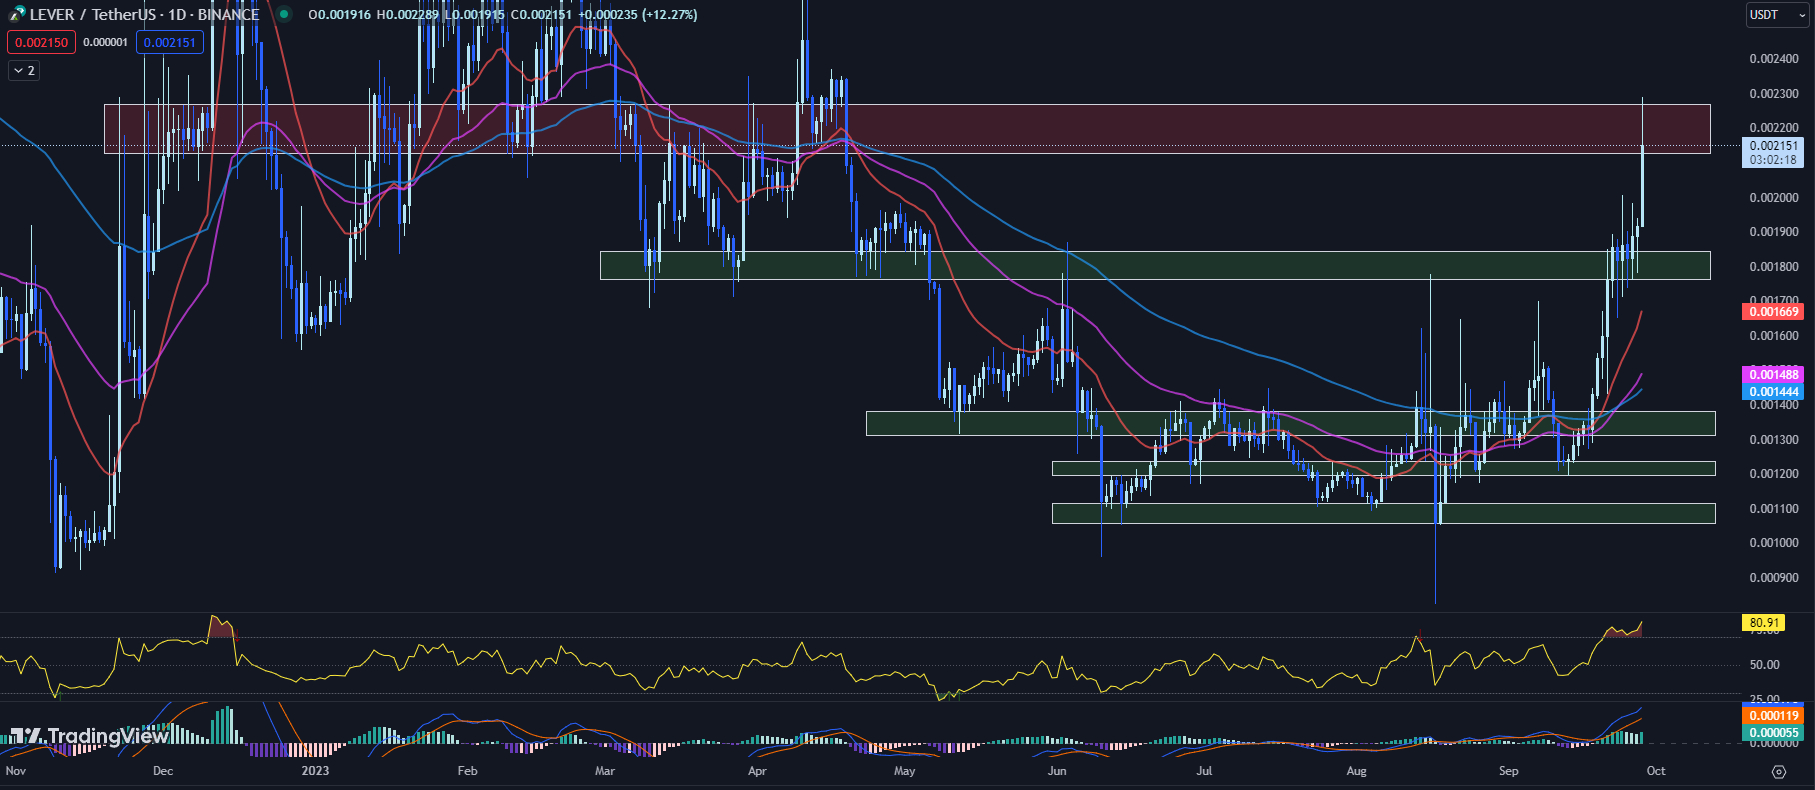
LEVER has continued its bullish momentum, reaching a new 5-month high of $0.002289 earlier today. However, it was unable to sustain this peak and retraced some of its gains. The LEVER price currently stands at $0.002151, still marking a respectable 12.27% rise for the day.
The LEVER price has been trading in the overbought territory as indicated by the Relative Strength Index (RSI) for the past eight days. The RSI, which currently stands at 80.91, is up from yesterday's 74.67, suggests that the market may be overbought.
The 20-day EMA currently stands at $0.001669, slightly above the 50-day EMA of $0.001488 and well above the 100-day EMA of $0.001444. This upward trend of the short-term EMA over the long-term EMA typically signals bullish sentiment. However, the steep RSI points to an overheated market, indicating that caution should be exercised.
The MACD histogram is at 0.000055, up from yesterday's 0.000045. This increase in the MACD suggests that bullish momentum is still in play. However, the overbought RSI could act as a counterbalance, potentially leading to a price correction.
The LEVER price currently faces an immediate resistance zone between $0.002127 and $0.002268. This is a crucial area that the cryptocurrency is attempting to breach. If LEVER successfully breaks this resistance, it could trigger a further surge in price.
On the downside, the immediate support zone lies between $0.001762 and $0.001843, where LEVER spent the time consolidating from September 21 to September 27. This area could act as a safety net, cushioning any potential downward price movements.
While the LEVER price has shown considerable strength, the overbought RSI suggests that a price retracement may be imminent. However, the positive trend in the EMAs and the increase in the MACD histogram indicate the persistence of bullish sentiment.
Investors should carefully monitor these technical indicators and the key price levels. A successful breach of the immediate resistance could signal a continuation of the bullish trend, while a drop to the immediate support may indicate a period of consolidation or even a reversal.
As always, investors are advised to trade cautiously and consider these factors alongside their risk tolerance and investment goals.
 cryptonews.com
