LRC is the Ethereum-based cryptocurrency token of Loopring, an open protocol designed for the building of decentralized crypto exchanges. The main idea behind Loopring is to combine elements of centralized and decentralized cryptocurrency exchanges to create a protocol that will enjoy its unique advantages and eliminate inefficiencies.
Let us look at the technical analysis of LRC.
Past Performance
LRC coin has a history of remaining around similar price levels for a very long time. However, in the past year, it has started to show some volatility with occasional freezes in the price point.
In the later part of the past week, the price has again started to stabilize. The LRC opened for trading at $1.48 on November 8, 2021. On November 14, 2021, it closed at $3.07. This was a weekly change of 107.43%.
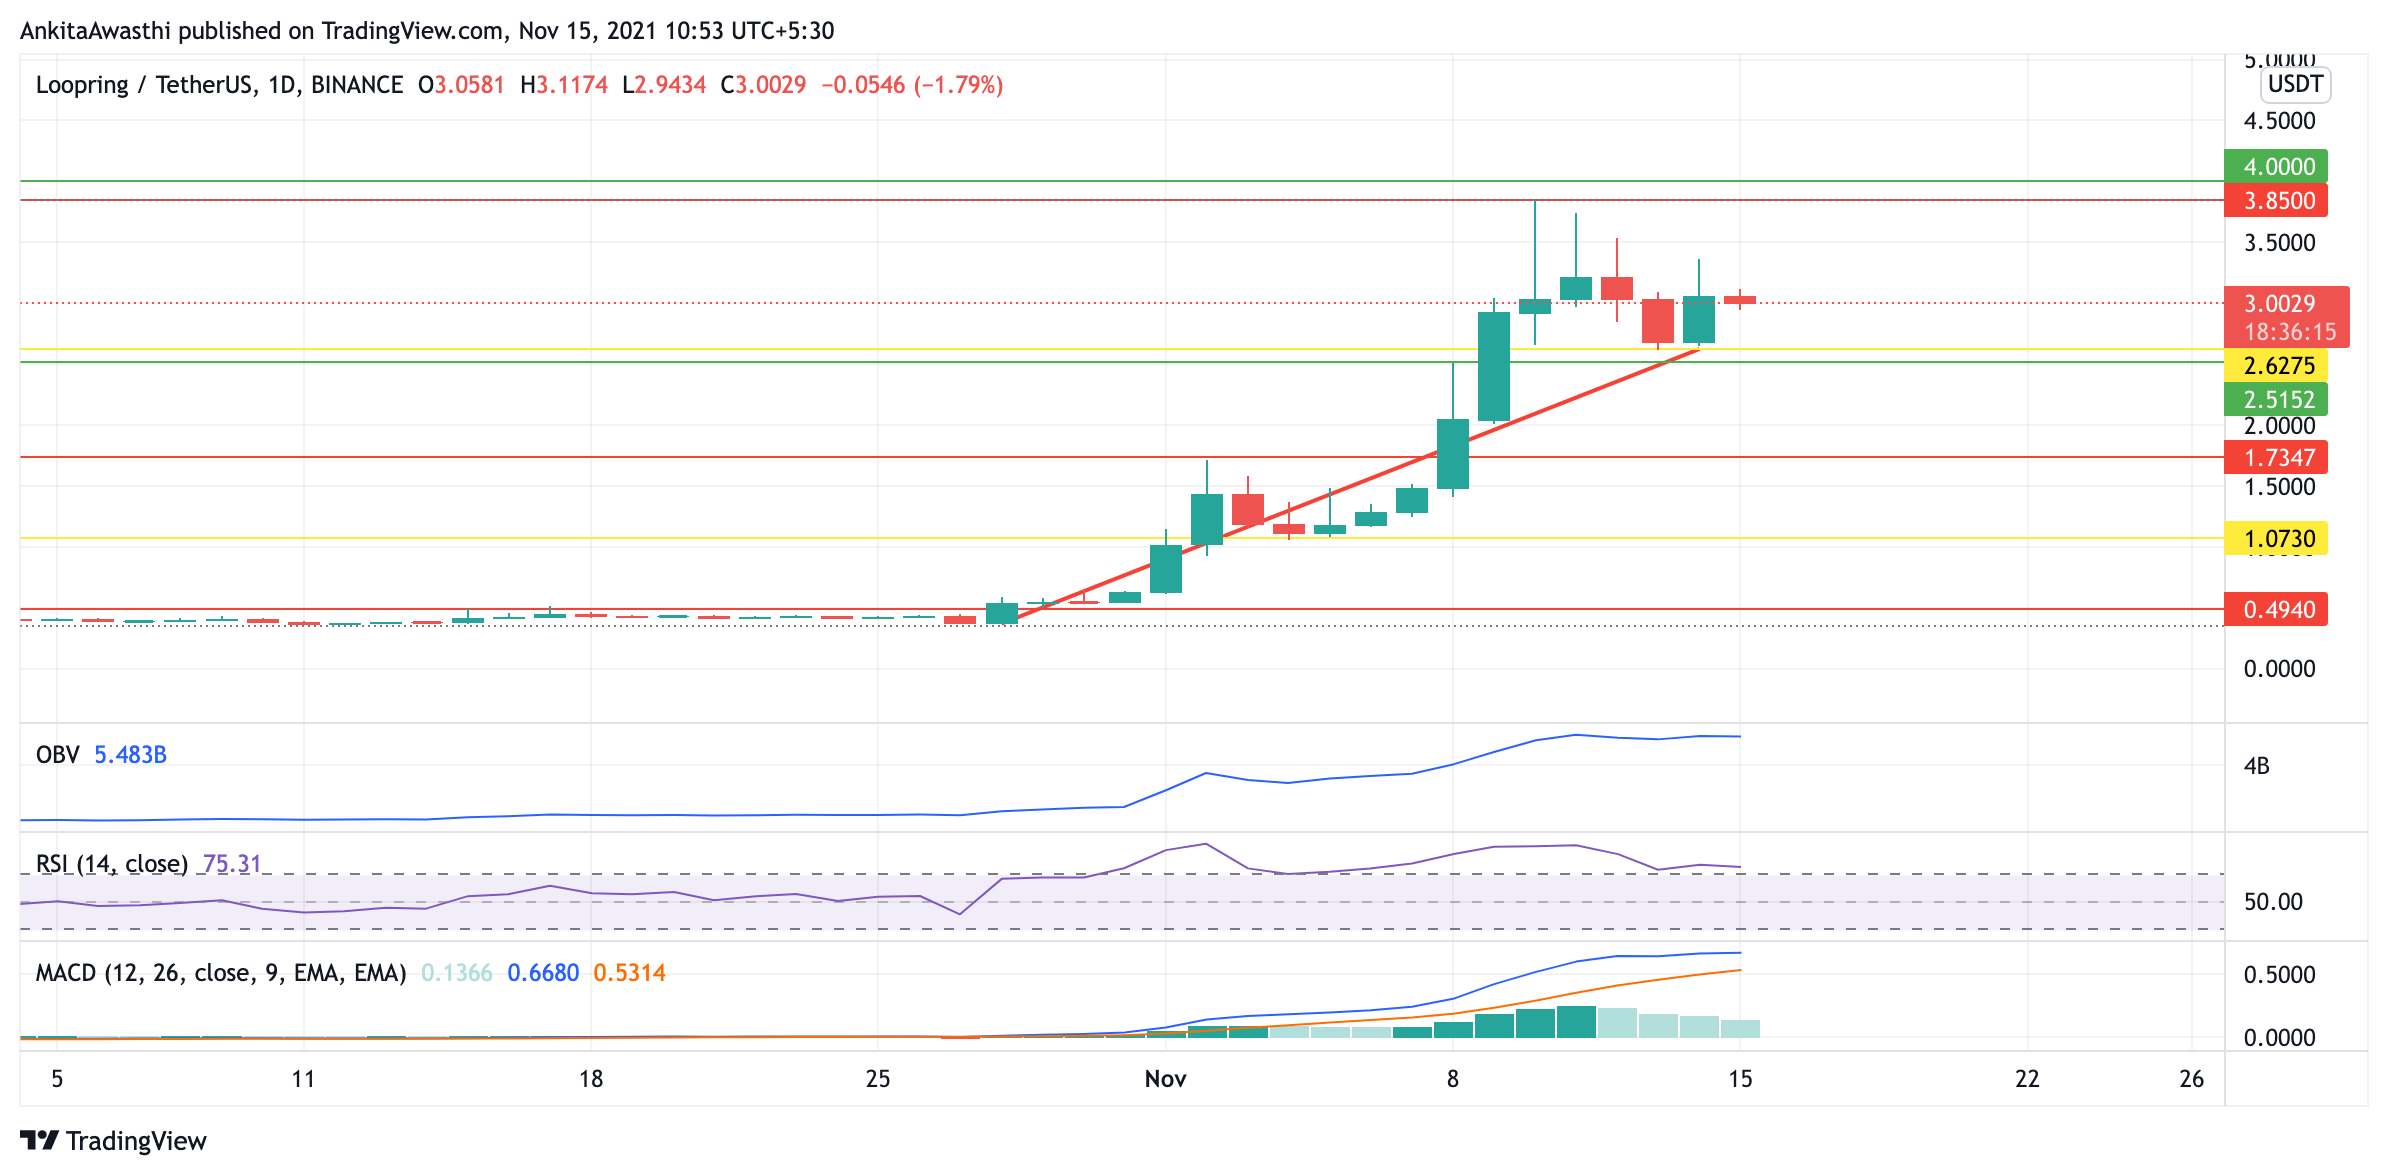
Source: https://www.tradingview.com/x/KzyXDQAk/
LRC Technical Analysis
The price chart can be seen to show some stability on the price over the last few days. Considering the historical pattern of the chart, the price may remain stable for some time before showing a significant deviation again. Let us look at what the oscillators have to show.
A fairly horizontal line can be seen at the end of the OBV graph, giving a neutral signal to the traders. This means that the buying and selling volumes are balancing each other.
The RSI is showing a beginning of a dip at the tip of its trend line. This can be a signal that a price correction may be seen. However, let us first wait for a clear signal before making a call based on this.
In the MACD graph, the fast line and slow line are approaching each other, thus reducing the gap between them. If this movement of the lines continues, a bearish crossover may be seen in the coming days.
Day-Ahead and Tomorrow
If you want to invest in this project, it can be seen stabilizing sometimes in the future, but it will need to be a long hold. Liquidity/users moving to L2 will not happen overnight. It will be a lengthy onboarding and education process.
If we look at the Fib retracement for the LRC price chart, we can see that the price is currently being tested at the pivot point of $3.03 for the past few days.
Thus, the oscillators are suggesting traders hold their current positions as the current signals are neutral. However, looking at the possible negative outcomes, as predicted by RSI and MACD in the coming days, traders may place a stop-loss at $2.5151.