Markets are again riding on slight bear activity today, with the global market cap sitting 0.06% below its previous 24-hour mark, as the total cap still stands at $1.05T as of press time. The fear and greed index is still at 39.
Bitcoin price analysis
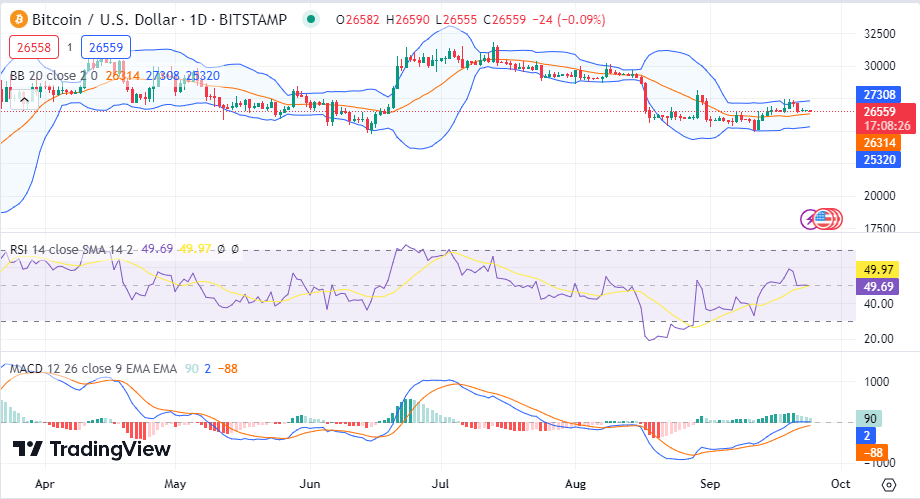
Bitcoin (BTC) has started on bear activity, as Bitcoin price stood at $26.55K as of press time after recording a daily decrease of 0.04%, and a weekly rise now stands at 0.06%. As a result of the Bitcoin price, the token’s trade volume dropped by 33% during the same period and is presently at $6.5B.
The Bollinger bands are now moving at a close distance, showing stable volatility levels on Bitcoin Price as the Relative Strength Index (RSI) currently above the average line, approaches a cross-over below the line as bears take effect. The MACD moves in the green zone as it moves towards the red zone, showing some bear effects on Bitcoin price.
Ethereum price analysis
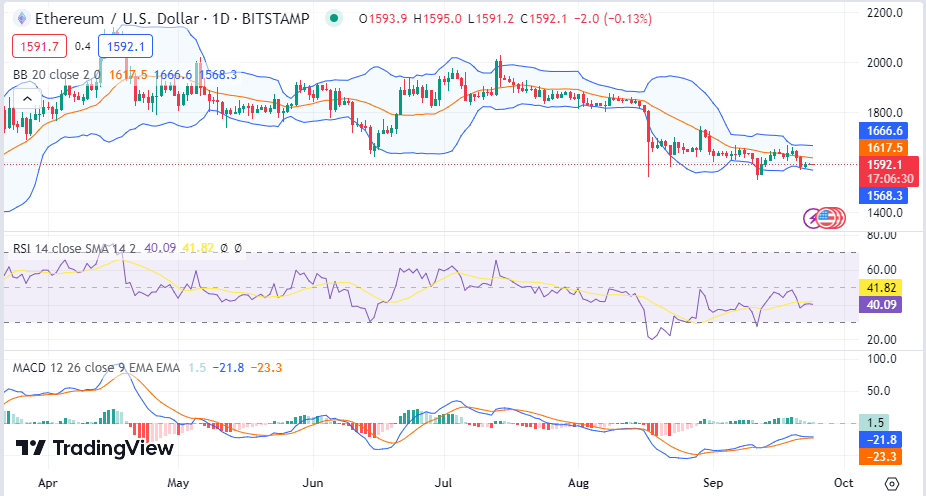
Ethereum (ETH) has also encountered slight bear activity, as Ethereum price stood at $1501 after recording a daily decrease of 0.13%, and the weekly drop now stands at 2.3%. ETH’s trade volume dropped by 39% during the same period and is presently at $1.9B.
The Bollinger bands are now slightly diverging, showing increasing volatility levels on Ethereum Price. The Relative Strength Index (RSI) is below the average line as bears now strive for dominance while the MACD moves in the green zone, as it approaches a shift to the red zone.
Pepe price analysis
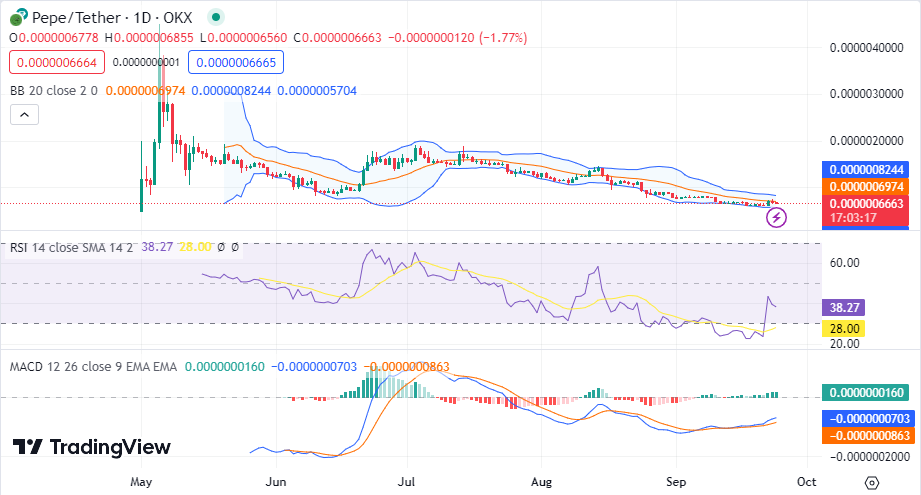
Pepe (PEPE) has also encountered bear activity, as Pepe price stood at $$0.0000006658 after recording a daily decrease of 3.2%, and the weekly rise now stands at 0.27%. Pepe’s trade volume dropped by 62% during the same period and is presently at $58.6M.
The Bollinger bands are moving close to each other, showing stable volatility levels on Pepe Price. The Relative Strength Index (RSI) is above the average line as bull effects remain felt on pepe price while the MACD moves in the green zone.
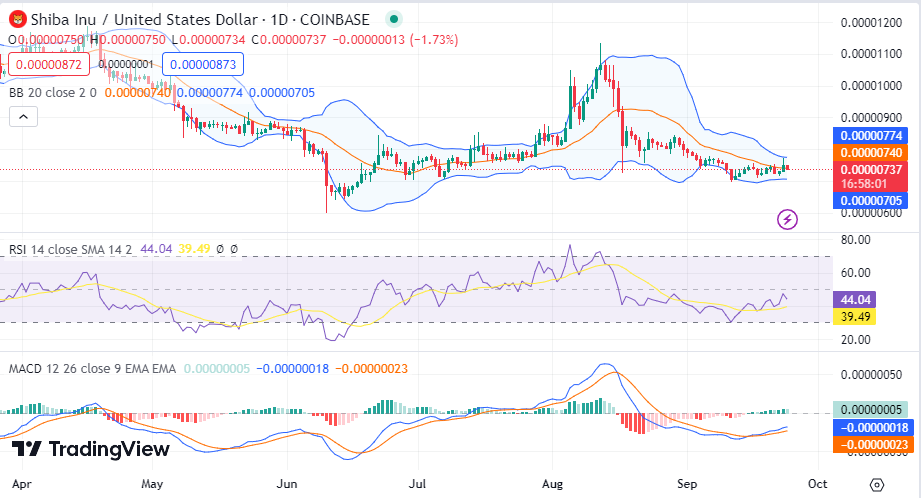
Shiba Inu price analysis
Shiba Inu (SHIB) has started on bull activity, as Shiba Inu price stood at $0.00000739 as of press time after recording a daily increase of 0.7%, and a weekly rise now stands at 0.72%. As a result of the Shiba Inu price, the token’s trade volume jumped by 97% during the same period and is presently at $138.44M.
The Bollinger bands are now converging, showing dropping volatility levels on Shiba Inu Price as the Relative Strength Index (RSI) moves above the average line showing bull effects on Shiba Inu. The MACD moves in the green zone, showing bull effects on Shiba Inu price.
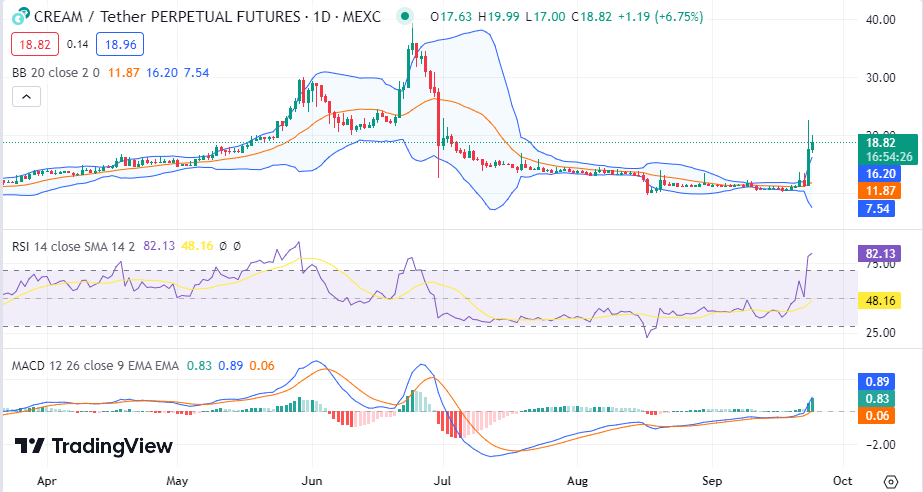
Cream Finance price analysis
Cream Finance (CREAM) has started on massive bull activity, as Cream Finance price stood at $17,95 as of press time after recording a daily increase of 56.2%, and a weekly rise now stands at 64%. As a result of the Cream Finance price, the token’s trade volume jumped by 1528% during the same period and is presently at $48.5M.
The Bollinger bands are now diverging, showing spiking volatility levels on Cream Finance Price as the Relative Strength Index (RSI) moves above the average line in the overbought region showing bull effects on Cream Finance. The MACD moves in the green zone, showing bull effects on Cream Finance price.