- 1 TWT token price shows a double bottom pattern on the charts.
- 2 Buyers are in trouble and tried to surpass the 20-day EMA.
TrustWallet (TWT token) price is near the lower trendline and made a double bottom pattern near the $0.7000 mark, which indicates that the downside is now capped and buyers are looking to retain the $0.8200 mark, followed by $0.8500. Moreover, the chart shows the lower lows formation, which looks like sellers have done their best and started covering their positions, and soon the trendline near $0.8000 may be broken.
Furthermore, the chart shows the descending triangle pattern; the price is close to the breakout region, showing the buyer accumulation and that the TWT price is close to the trendline. However, bulls must first breach the 20-day EMA to extend the buying momentum to register the trendline breakout above the swing hurdle of $0.8200.
Trust wallet token price is close to the 20-day EMA, but bulls couldn’t sustain and faced rejection multiple times, indicating weak buying momentum. Moreover, the price action did not favor a breakout due to the short buildup activity and suggested that the consolidation will continue. Buyers may face further slippages toward the round mark of $0.7000.
At press time, TWT price is $0.7800 with an intraday drop of 0.43%, showing bearishness over the past number of sessions. Moreover, the trading volume remained average at 325.897K, and the pair of TWT/BTC was at 0.0000294 BTC. However, the market cap of TWT is $949.45 Million. Furthermore, analysts maintained a sell rating due to the negative performance over the past months. TWT has a weekly return of -2.92% and monthly (-9.05%).
TWT Price Action Suggest Downtrend on Daily Charts
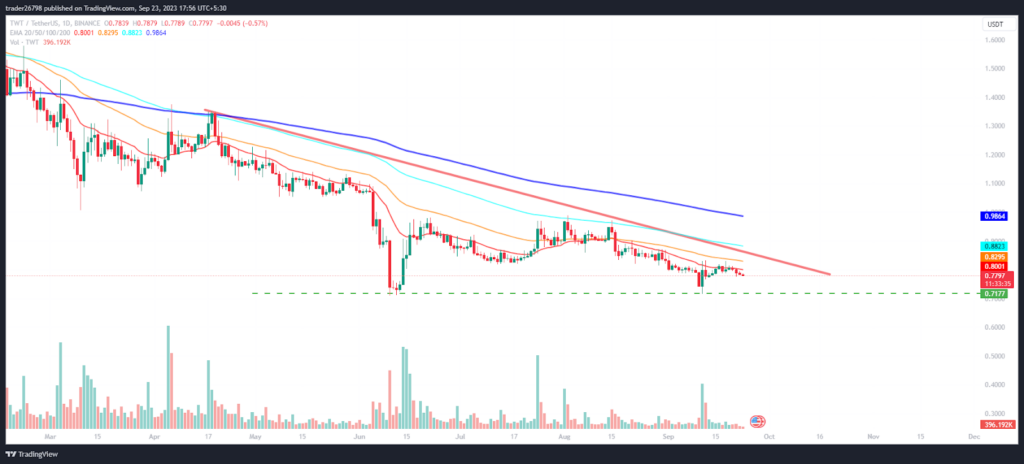
On the daily charts, TWT price is trading below neutrality, showing a downtrend over the past few sessions. Furthermore, the chart structure favors the bears and indicates further downside risk to $0.7000, which may see if the price slips below the immediate support of $0.7500. Furthermore, TWT is trading near the 23.6% Fib zone and is trying to attain the 38.2% zone soon. Moreover, the price is below the mid-Bollinger band, heading toward the lower Bollinger band. Furthermore, the band is tightening now, signaling a breakout could be witnessed soon.
Will TWT Escape the 200 Day EMA Hurdle?
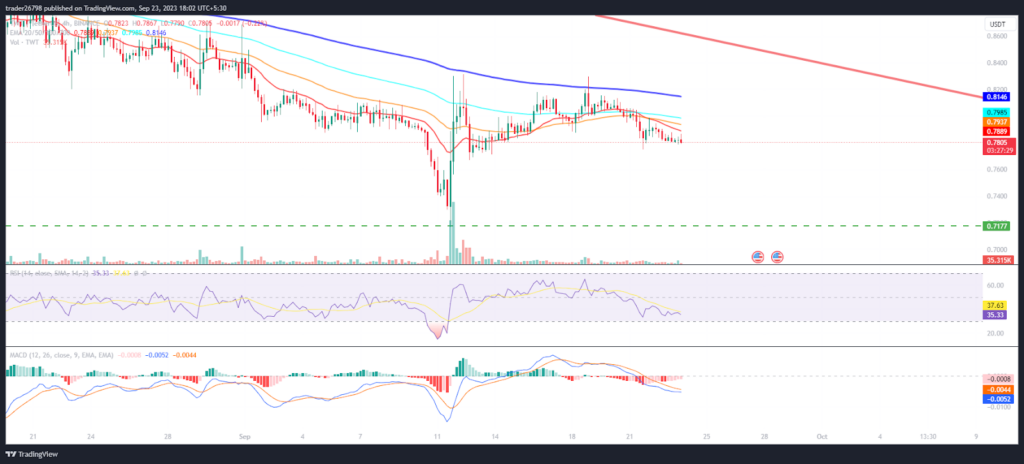
On the 4-hour charts, TWT price is trading below the cluster of $0.8000 and trying to surpass the 200-day EMA. However, the technicals suggest further consolidation instead of a breakout, and TWT price may struggle below the 200-day EMA in the upcoming sessions.
The RSI curve stayed below neutrality, showing a bearish divergence and suggesting a negative outlook for the following sessions.
The MACD shows a bearish crossover and red bars on the histogram, highlighting seller dominance on the charts.
Summary
Trust wallet token (TWT token) price is in the bear trajectory and has faced selling pressure over the past sessions. Furthermore, the price is trading below the cluster of $0.8000 and hovering near the 20-day EMA, where bulls are trying to sustain but failed. Furthermore, the technicals are not favoring the bounce; the token could fall further to the $0.7000 mark.
Technical Levels
Support Levels:$0.7000 and $0.6500
Resistance Levels: $0.8500 and $0.9000
Disclaimer
The views and opinions stated by the author or any other person named in this article are for informational purposes only and do not constitute financial, investment, or other advice. Investing in or trading crypto or stocks comes with a risk of financial loss.