- 1 $SNX price faced rejection from the 200-day EMA in the past few sessions.
- 2 Buyers are looking weak and unable to escape the primary hurdle of $2.50.
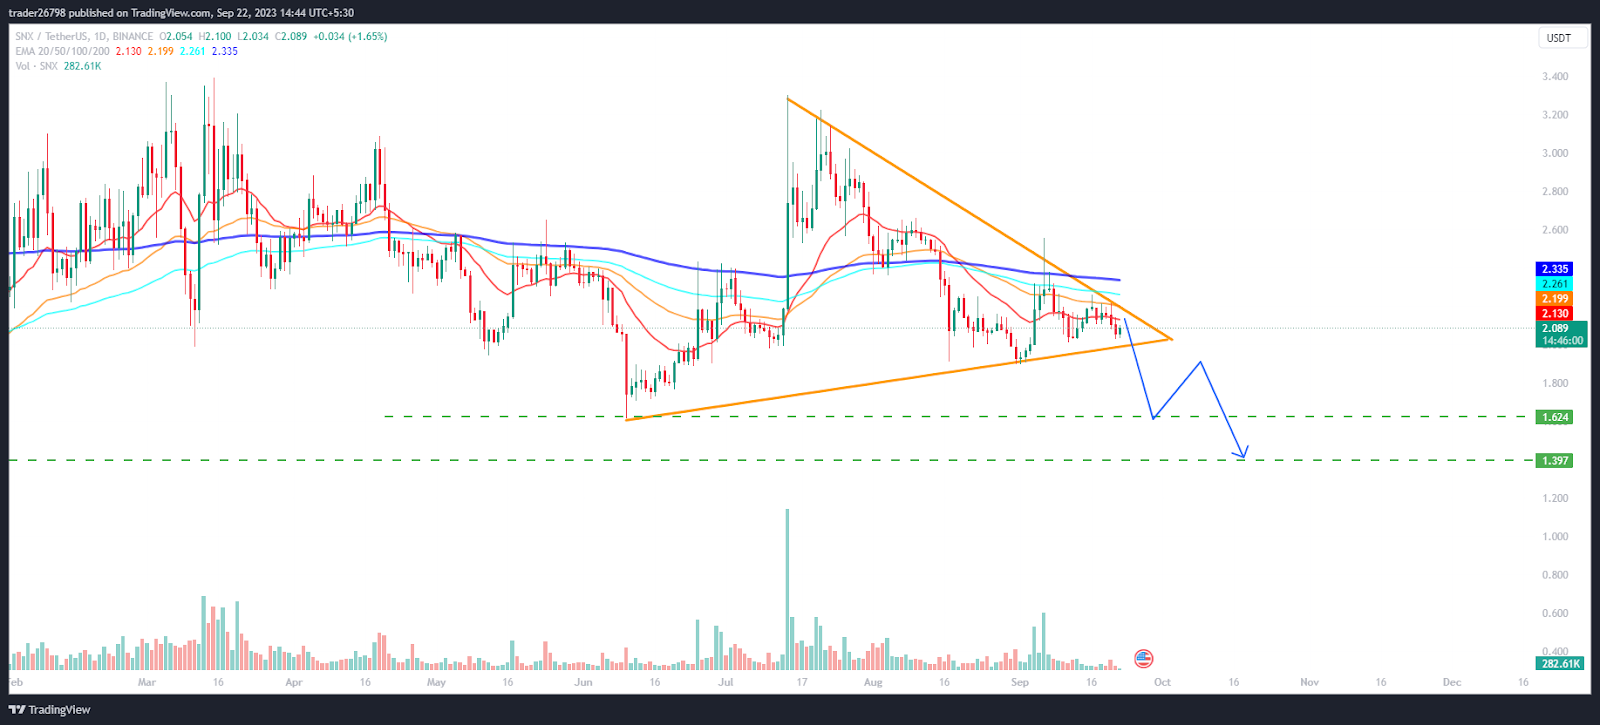
Synthetix ($SNX) price forms a symmetrical triangle pattern and hovers near the lower trendline of $2.050. Moreover, the price action shows that $SNX price failed to surpass the 200-day EMA and stayed in a narrow congestion zone, indicating weak cues on the charts. Furthermore, the $SNX price is trading below the significant moving averages and trying to sustain the 20-day EMA for the past sessions. $SNX price is forming lower lows and suggests a breakdown below $2.000. Moreover, if the price slips below the trendline, it could go toward $1.300, as shown by the curve on the chart.
$SNX price action indicates bearishness. Staying in the bear trajectory suggests follow-on selling is likely, and that $SNX could break down soon. Furthermore, sellers persisted in short buildups and are looking to drag $SNX price below the trendline to initiate a selloff. However, bears need momentum to break the trendline because the round level of $2.000 is the strong support zone, and sellers are challenged to break the zone. Conversely, the trendline of $2.150 is the immediate resistance zone, which bulls need to surpass to reverse toward the upper trendline of $2.210.
At press time, $SNX price is trading at $2.10 with an intraday drop of 0.82%, showing neutrality on the charts. Moreover, the trading volume increased by 3.59% to $20.45 Million, and the pair of $SNX/$BTC is at 0.0000784 $BTC. However, the market cap of Synthetix is $679.89 Million. Analysts maintained a sell rating and suggested a significant downturn in the upcoming sessions.
$SNX Forms Symmetrical Triangle Pattern on Daily Charts
 $SNX Price Prediction: $SNX Shows Weak Cues, Will it Hold $2?">
On the daily charts, $SNX price trades inside the symmetrical triangle pattern and looked weak in the past few sessions. Furthermore, the price action signals an upcoming breakdown below the trendline of $2.00 due to aggressive short additions in the past sessions. Moreover, Synthetix price is below the 50% Fib zone and is dragging below the mid-Bollinger band, suggesting that bears have attained strength.
What Technical Indicators Suggest?
 $SNX Price Prediction: $SNX Shows Weak Cues, Will it Hold $2?">
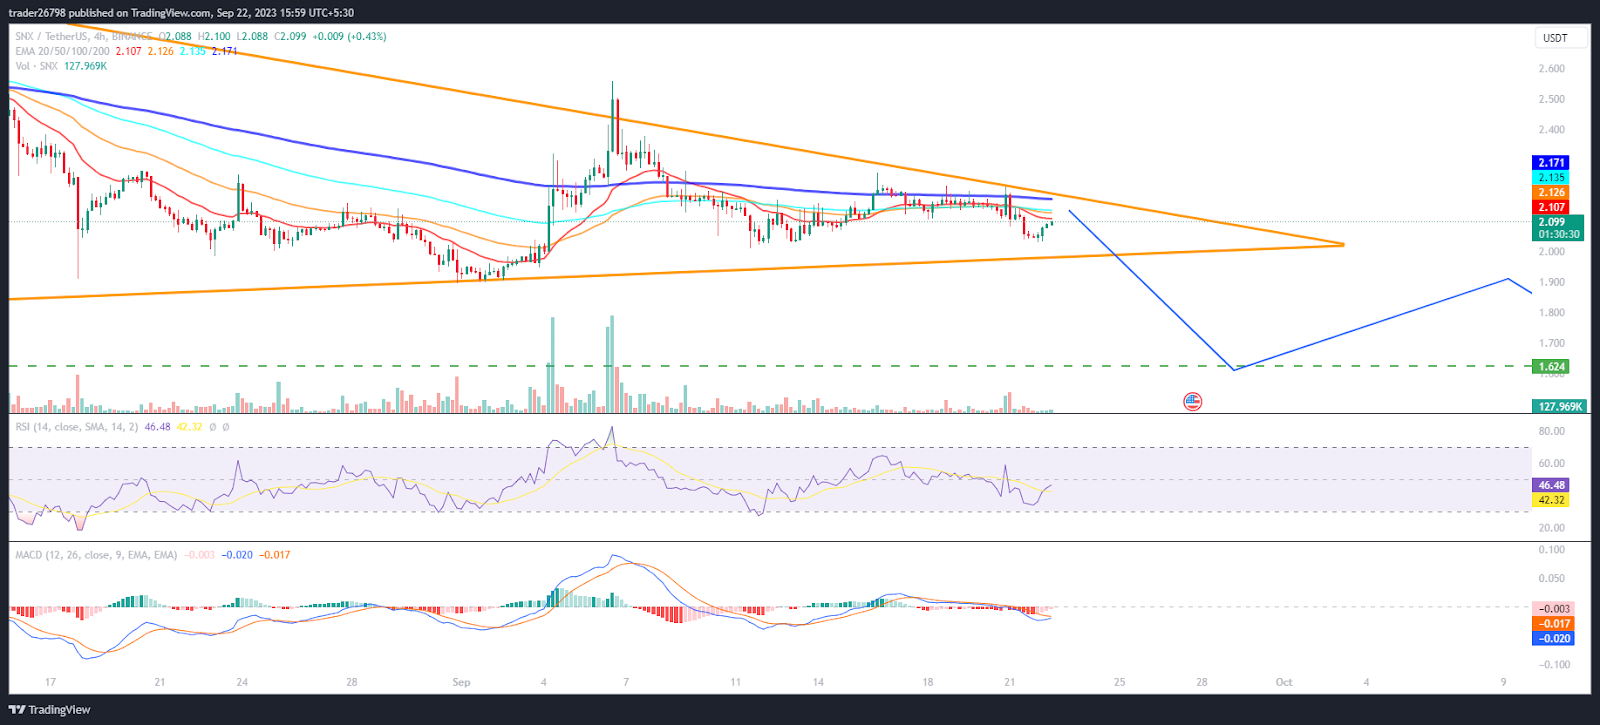
On the 4-hour charts, $SNX shows a breakdown of the consolidation zone, trading below the lower neckline of $2.100. Moreover, the price shows strong seller interest, and that the bulls are now in trouble. The RSI curve stayed near neutrality, showing a bearish divergence. However, the positive crossover suggests volatility on the charts.
The MACD shows a bearish crossover and red bars on the histogram, suggesting a significant pullback in the upcoming sessions.
Summary
Synthetix ($SNX) price trades below the neutrality show lower investors’ interest and are hovering near the lower trendline of the symmetrical triangle pattern, indicating bearishness for the past sessions. Moreover, the chart shows the long unwinding activity and suggests a further downside is possible till $2.00.
Technical Levels
Support Levels: $2.000 and $1.800
Resistance Levels: $2.200 and $2.500
Disclaimer
The views and opinions stated by the author or any other person named in this article are for informational purposes only and do not constitute financial, investment, or other advice. Investing in or trading crypto or stocks comes with a risk of financial loss.