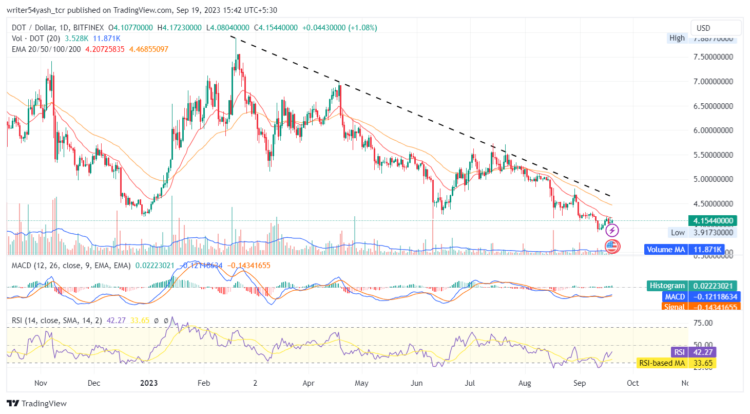
- 1 The Polkadot’s price took major rejection at $7.5 and decreased by 8.11% over the last week trading beneath the major EMAs.
- 2 The price of Polkadot is trading at $4.1544 and the 52-week range is between $3.9173 – $7.8877.
Polkadot fell 0.11% in market value and rose by 36.46% in trading volume in the last 24 hours, as per CoinMarketCap, which is a crypto data and information website. Its market value is $5,082,308,034 and its trading volume is $112,906,927. There are 1,224,892,325 DOT in circulation which is the amount of DOT coins that are circulating in the market and are in public hands.
According to CoinMarketCap, a community called Wu Blockchain reported that PolkaWorld, a leading Chinese community for Polkadot, shut down its operations on September 15th. The community had been inactive for two weeks before the announcement, due to the lack of funding from the official Treasury of Polkadot.
The main reason for the funding rejection was the disagreement over the financial management under OpenGov, a governance model that allows stakeholders to vote on proposals. This had a negative impact on many long-term contributors and organizations that were part of PolkaWorld, as they felt unsupported and frustrated by the Treasury’s decisions. Many of them decided to leave the Polkadot ecosystem and pursue other projects.
PolkaWorld was one of the largest and most active Chinese communities for Polkadot, with over 20,000 members and 300 articles. It was also involved in various initiatives, such as hosting events, translating documents, and promoting education. The community’s closure has raised concerns over the future of Polkadot’s development and adoption in China.
Technical Analysis of DOT on 1-D Timeframe
Polkadot price is falling and faces strong resistance at $7.5. It made lower highs and lows and declined drastically. On observing the charts in detail, it is seen that the DOT price experienced a severe sell-off situation.
The Polkadot price is now at $4.1544 and the price is facing resistance from EMAs and the DOT price showed a minor increase and a major decrease in its activity.
The Polkadot price could ascend more if it breaks EMAs one by one. If more buying volume adds up, then the price might conquer rejecting EMAs by making higher highs and lows. Then, the next probable resistance levels could be $4.5 and $5.0, based on the previous highs and lows.
The Polkadot price may drop further if it fails to break the current resistance and keeps falling. The next support levels could become $3.5 and $3.0.

At the time of publishing, the Polkadot price (DOT) is trading below the 20, and 50-day EMAs (exponential moving averages), rejecting the Polkadot price trend.
The MACD line and the signal line are below the zero line and both lines crossed each other multiple times but the histogram gap is lean in the MACD oscillator, highlighting traits of lack of momentum in the DOT crypto’s market.
The current value of the RSI is 41 points and the 14-day SMA is below the median line at 33 points indicating neutral to bearish sentiment. Collectively, the indicators outlook is neutral to bearish.
Conclusion
The Polkadot price prediction shows a neutral to bearish outlook from investors and traders in the daily time frame. DOT price action reveals a neutral to downward trend at the time of writing. Moreover, the daily chart shows that the DOT price trend is bearish. The RSI, EMA, and MACD indicate that the price may either stay in a range or continue to decline.
Technical Levels
- Support levels: $3.5 and $3.0
- Resistance levels: $4.5 and $5.0
Disclaimer
In this article, the views and opinions stated by the author, or any people named are for informational purposes only, and they don’t establish the investment, financial, or any other advice. Trading or investing in cryptocurrency assets comes with a risk of financial loss.
 thecoinrepublic.com