- 1 Astar (ASTR) price is down by 0.30% in the past 24 hours and is currently trading at $0.05.
- 2 Astar price slipped below the key moving average of 50-day EMA.
- 3 ASTR price forms a bearish flag pattern over the daily chart.
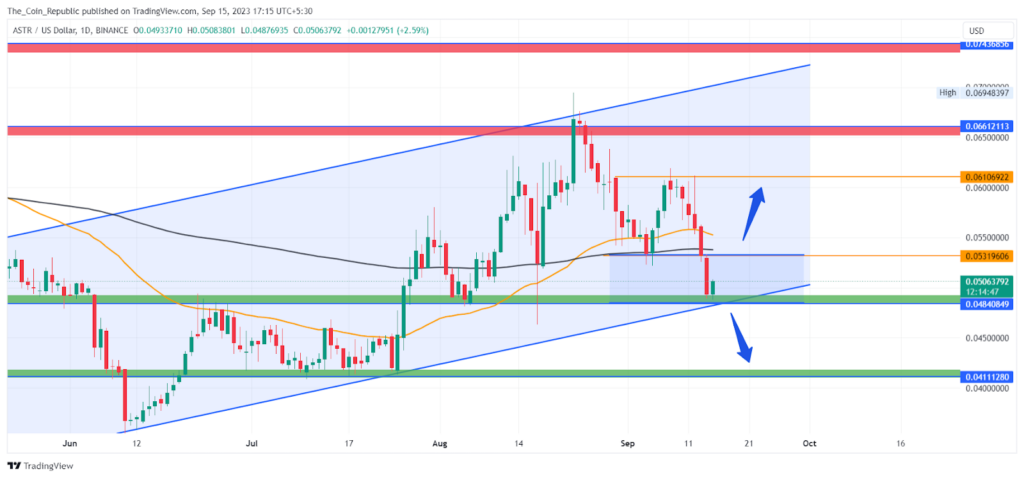
The daily charts illustrate that the Astar crypto price forms a bearish flag pattern and maintains itself on the boundary of the channel pattern. The price has currently dropped to the lower boundary of the channel from where it may get buyers’ volume to surge higher.
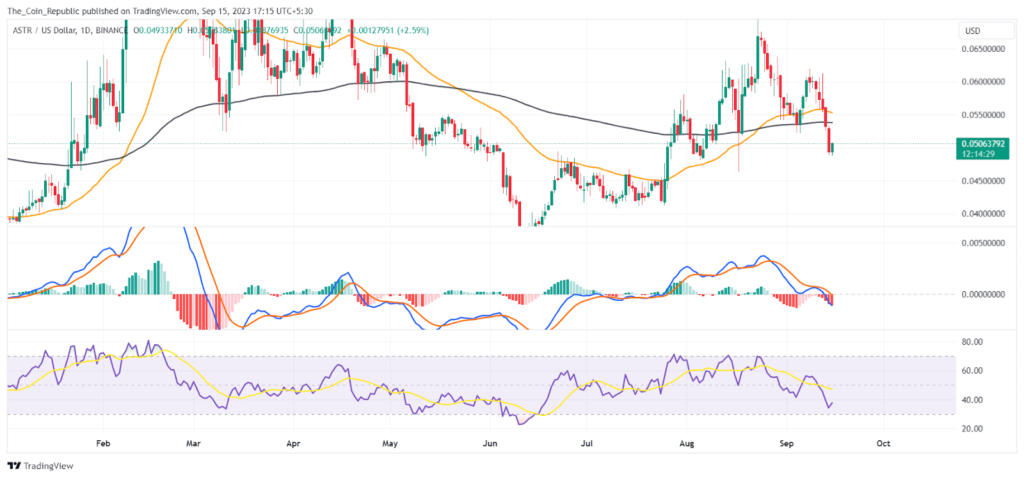
The technical indicators imply that the price slipped below the 50-day and 200-day exponential moving averages indicating the sellers’ dominance in the short-term. The RSI declined below the mid-level. The ASTR coin will need more buyer support to protect previous lows.
Astar is a multi-chain smart contract platform that supports various Layer 2 solutions, blockchains, and virtual machines. It uses Parity Substrate, a Web3 blockchain-building platform that enables fast and easy blockchain development. Astar also has features like operator trading, which lets users tokenize, transfer, or assign smart contracts to other users.
Astar Price Forms Bearish Flag Pattern Over Daily Timeframe

The Astar crypto price is currently trading at $0.05 with an intraday loss of 0.30% and trading at the lower boundary of the channel pattern.
The short-term outlook of the price trend states that the price might try to maintain the channel pattern and receive the buying volume from the recent support. However, if the buyers fail to raise the price higher, it may lead to a breakdown of the bearish flag pattern and the price may decline sharply.
The volume analysis shows that the ASTR token has a 24-hour volume below the average volume indicating weakness. The ASTR crypto has a 24-hour volume of $12.04 Million with a decrement of 24.8% in the past 24 hours. The volume-to-market cap ratio is 4.53% indicating mild volatility in the market.
Technical Indicators Show Sideways Trend Over the Daily Chart

MACD lines are showing a bearish crossover. The histogram bars are also being formed below the mean line indicating the ASTR crypto price might decline more.
The EMA analysis shows that the ASTR crypto price slid below the 50 EMA and 200-day EMA indicating the presence of the sellers at the upper levels.
At the time of publishing, the RSI value of the ASTR token is 37.4 and that of the SMA line is 48.2. RSI is declining suffering rejection from the SMA line indicating the sellers’ dominance at the moment.
Conclusion
Astar crypto price is in a bearish flag pattern and trades at the lower boundary of the channel. The price is below the 50-day and 200-day EMAs and the RSI is below the mid-level. The price needs more buyers to avoid a breakdown of the flag and a sharp decline. The volume is low and shows weakness.
Technical Levels
- Support levels: $0.048 and $0.0411
- Resistance levels: $0.053 and $0.061
Disclaimer
The views and opinions stated by the author, or any people named in this article, are for informational purposes only and do not establish financial, investment, or other advice. Investing in or trading crypto or stock comes with a risk of financial loss.
 thecoinrepublic.com
