COMP coin price consolidates within a range after a downfall. Thus, increasing the chances of a bullish reversal to $500.
The Compound is a decentralized finance lending program that allows users to earn interest on their cryptocurrency by depositing it into one of the supported pools.
In recent significant news, the release of the Q3 report of Compound Finance by Messari increases the talks of the Defi program within investing community.
Let us now take a look into the technical analysis of Compound.
Past Performance of COMP
After the supply dump near the $500 mark resulted in the downfall of 40%, COMP coin price undergoes consolidation. The range formation in the daily chart brings the opportunity of a bullish reversal if the price breaks above the range.
At press time, the coin price was $334.70, with a rise of 3.46% in the past 24 hours. Moreover, the intraday trading volume of Compound grows 180% in a day.
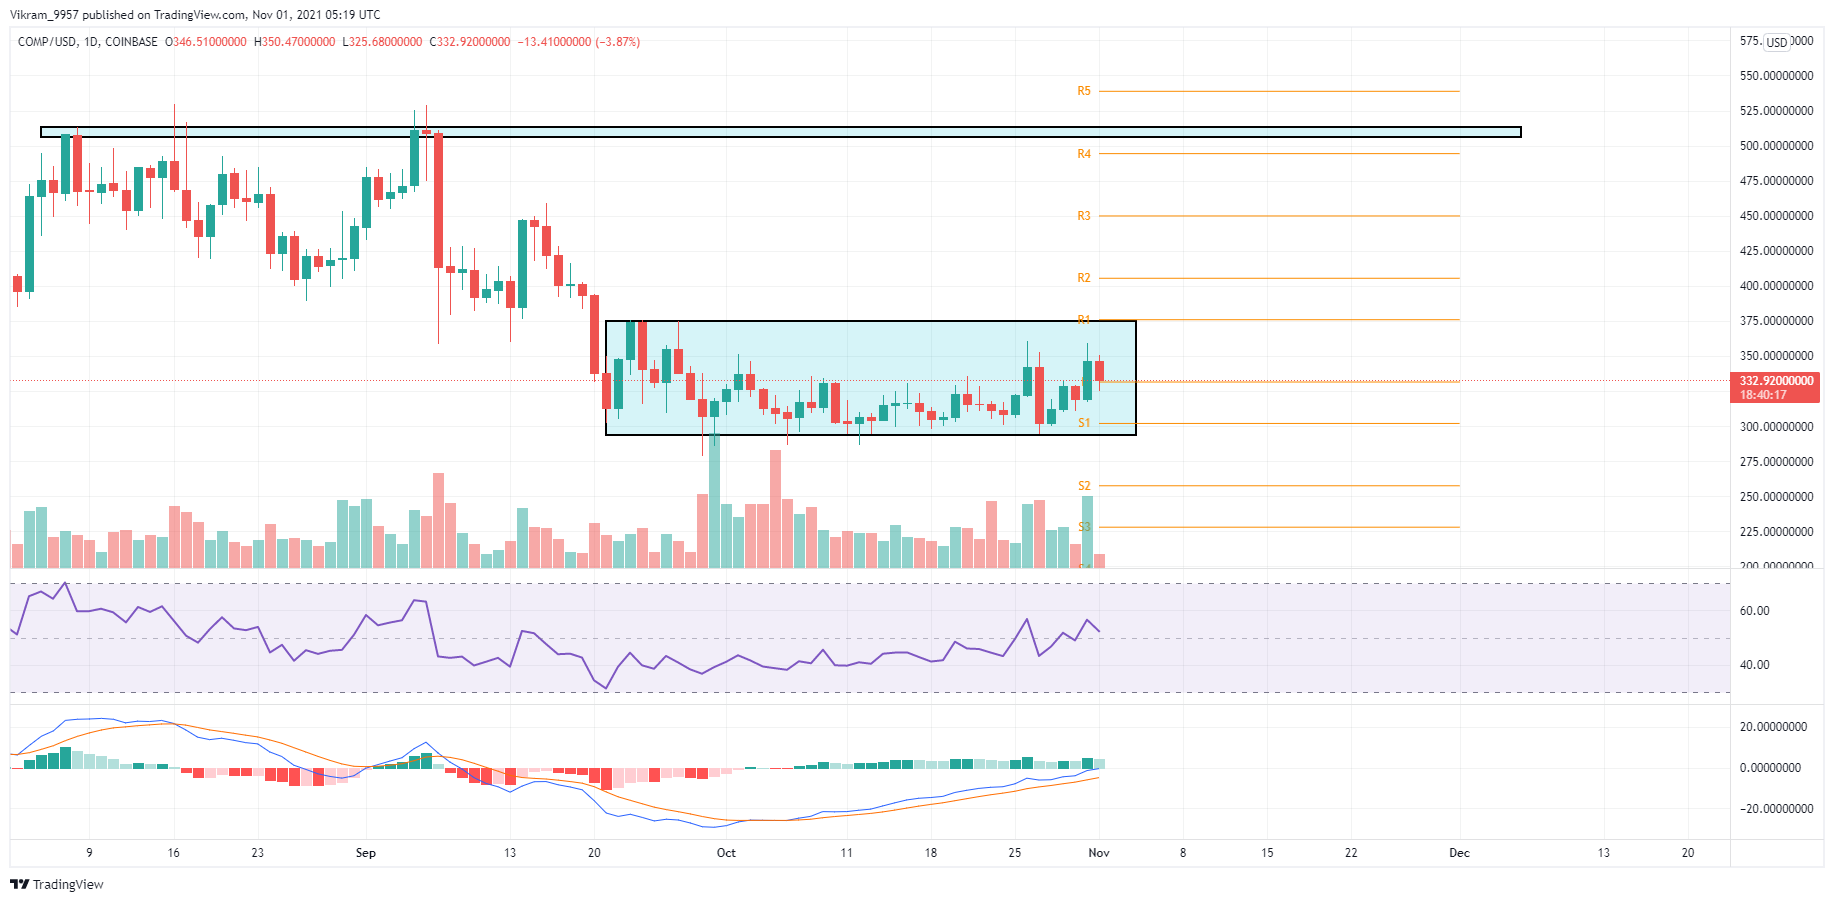
COMP/USD Daily Chart
COMP Technical Analysis
The consolidation range in the daily chart has been active for more than a month. Hence, the breakout of either side can release a substantial underlying momentum resulting in a solid future trend of the COMP coin.
The breakout of the $375 resistance can be considered a suitable entry spot for a range breakout. Upon breakout, Pivot Points indicate resistance levels near $406 and $450. However, a reversal from the range’s resistance can find support levels at $300.
The RSI slope rises gradually as the price grows within the range. The slope is above the 50% mark, reflecting the growth in buying pressure. Furthermore, there is no significant divergence between RSI and price action. As a result, the RSI indicator gives a buy signal for Compound.
The MACD and the signal line rise higher in the daily chart. Meanwhile, the fast line above the slow line reflects a positive alignment. Furthermore, the histograms show incredible growth in bullish momentum. Hence, the MACD indicator aligns with the RSI to give a buy signal for the COMP token.
Upcoming Trend
As per the technical analysis of the Compound token, the COMP price action gains bullish sentiments among investors. Furthermore, the technical indicators forecast a high possibility of an upside breakout. As a result, investors can find entry opportunities upon a $375 breakout.