ICX grows in an uptrend but struggles to rise above the crucial resistance zone of the $2.3 mark. Hence, price action forms an ascending triangle.
ICON is an open-source blockchain network that promotes interoperability. ICON's blockchain transmission protocol allows for independent blockchains, such as Ethereum or Bitcoin, to communicate and transact with one other. Cross-chain applications are possible with ICON's interoperability layer.
ICONLOOP developed loopchain, which is the engine that powers ICON's blockchain. ICONLOOP is responsible for loopchain's governance and enterprise adoption in South Korea. Loopchain is a standard blockchain platform for the Seoul Metropolitan Government.
Let us now take a deep look into the technical analysis of Icon.
Past Performance of ICX
Despite multiple attempts by the bulls, the ICX coin price struggles to rise above the $2.3 mark. As a result, the uptrend forms an ascending triangle pattern with the $2.3 resistance. Hence, traders can find entry opportunities upon breakout of either side.
The uptrend results in a 5.42% price jump in the last 24 hours. Moreover, the coin price gained 80% in intraday trading volume. And, at press time, the coin was trading at $2.25.
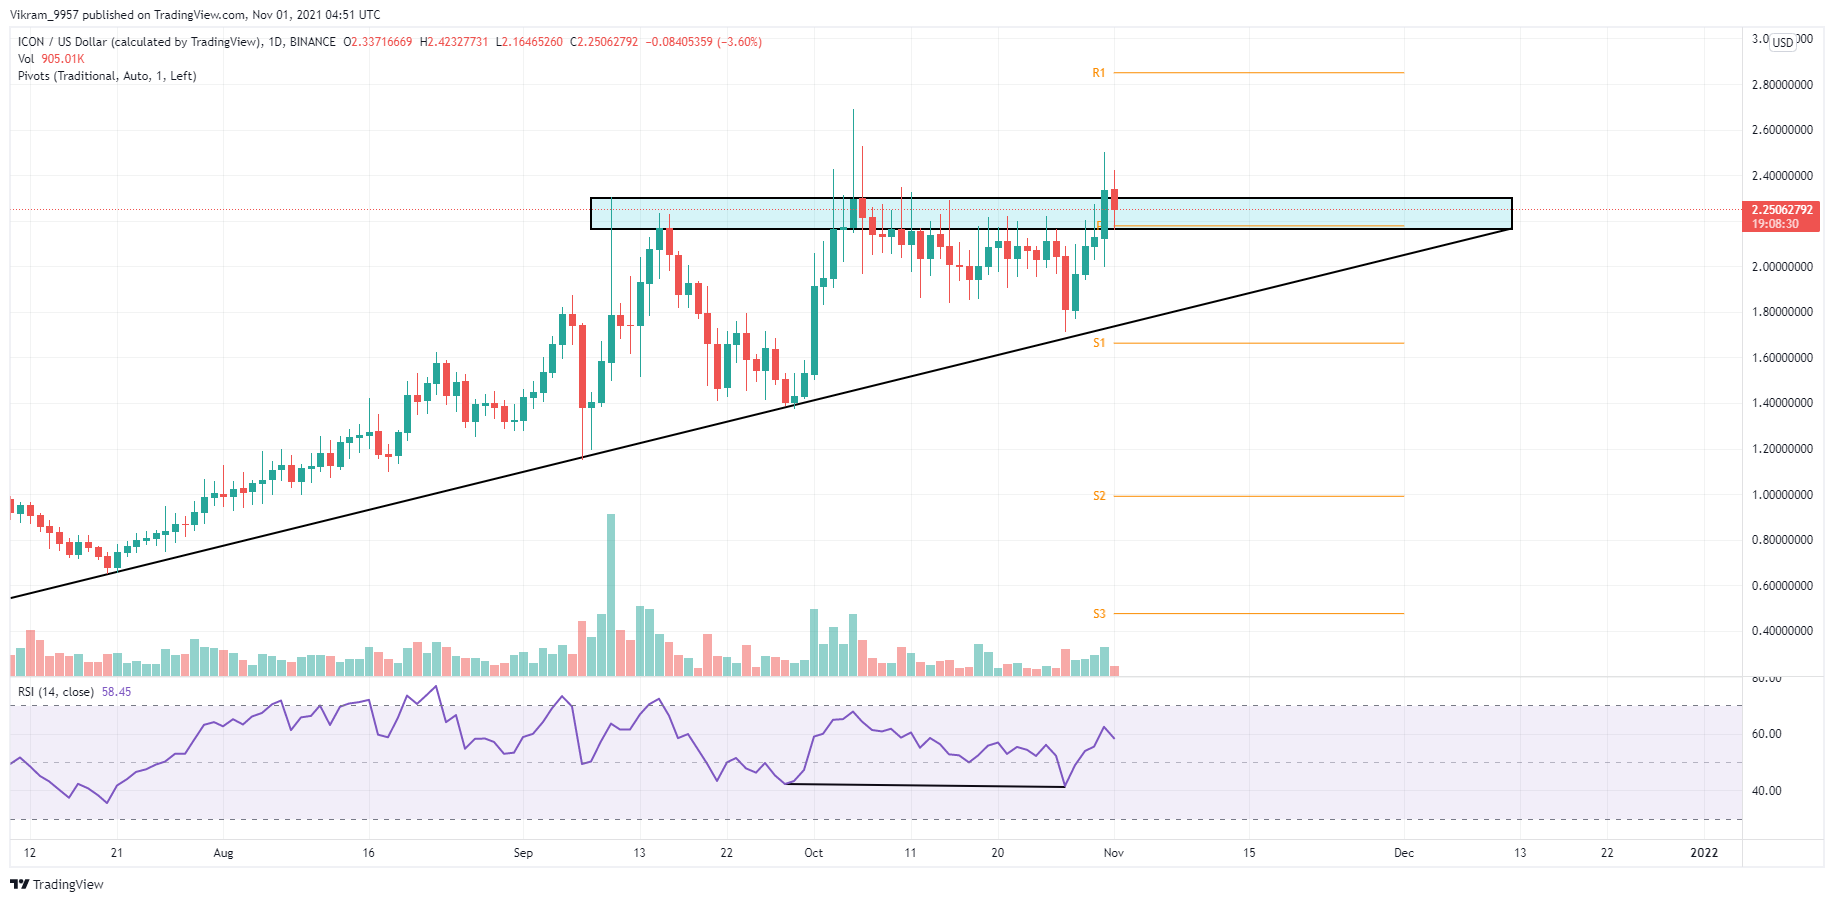
ICX/USD Daily Chart
ICX Technical Analysis
The ascending triangle in the daily chart fills up as the ICX coin price resonates within. As a result, we can shortly observe a breakout of either side. However, traders can find reversal opportunities within the pattern before the breakout.
The breakout of the $2.30 resistance can be considered a suitable entry spot to maximize profit with minimum risk. Upon breakout, Pivot Points indicate supply levels at $2.85 and $3.35. However, a fallout below the support trendline can find demand between the $1.6 and $1.3 levels.
The RSI slope is at 58%, maintaining the growth in the positive segment. Moreover, the bullish divergence resulted in the recent price jump. As a result, the RSI Indicator forecasts a buy signal for ICX coin.
The MACD and the Signal line give a bullish crossover in the daily chart as the price action struggles to rise above $2.30. Hence, MACD gives a bullish signal.
Upcoming Trend
As per the technical analysis of the Icon token, the ICX price action may soon give a bullish breakout of the ascending triangle. Moreover, the aforementioned technical indicators forecast a rise in bullish momentum. Hence, traders with bullish intentions can find the opportunity shortly.