
The Litecoin ($LTC) price has increased since August 17, creating a bullish double-bottom pattern.
A breakout from the descending resistance line will confirm that the correction is complete and that the bottom is in.
Litecoin Price Creates Bullish Pattern
The daily timeframe technical analysis for $LTC shows that the price has fallen under a descending resistance line since its yearly high of $115 on July 3. The decrease led to a low of $56 on Aug. 17. Litecoin bounced afterward, creating a long lower wick (green icon).
Crypto investing, simplified. Get $LTC price predictions here.
While the price returned to its previous low on Sept. 11, it created a double bottom pattern. The double bottom is considered a bullish pattern, meaning it usually leads to breakouts. Furthermore, the pattern was combined with a bullish divergence in the RSI.
The RSI is a momentum indicator used by traders to assess whether a market is overbought or oversold and to make decisions about accumulating or selling an asset. Readings above 50 and a rising trend signal an advantage for bulls, while readings below 50 indicate the opposite.
A bullish divergence occurs when a price decrease is combined with a momentum increase. It is a bullish sign that often leads to significant increases.
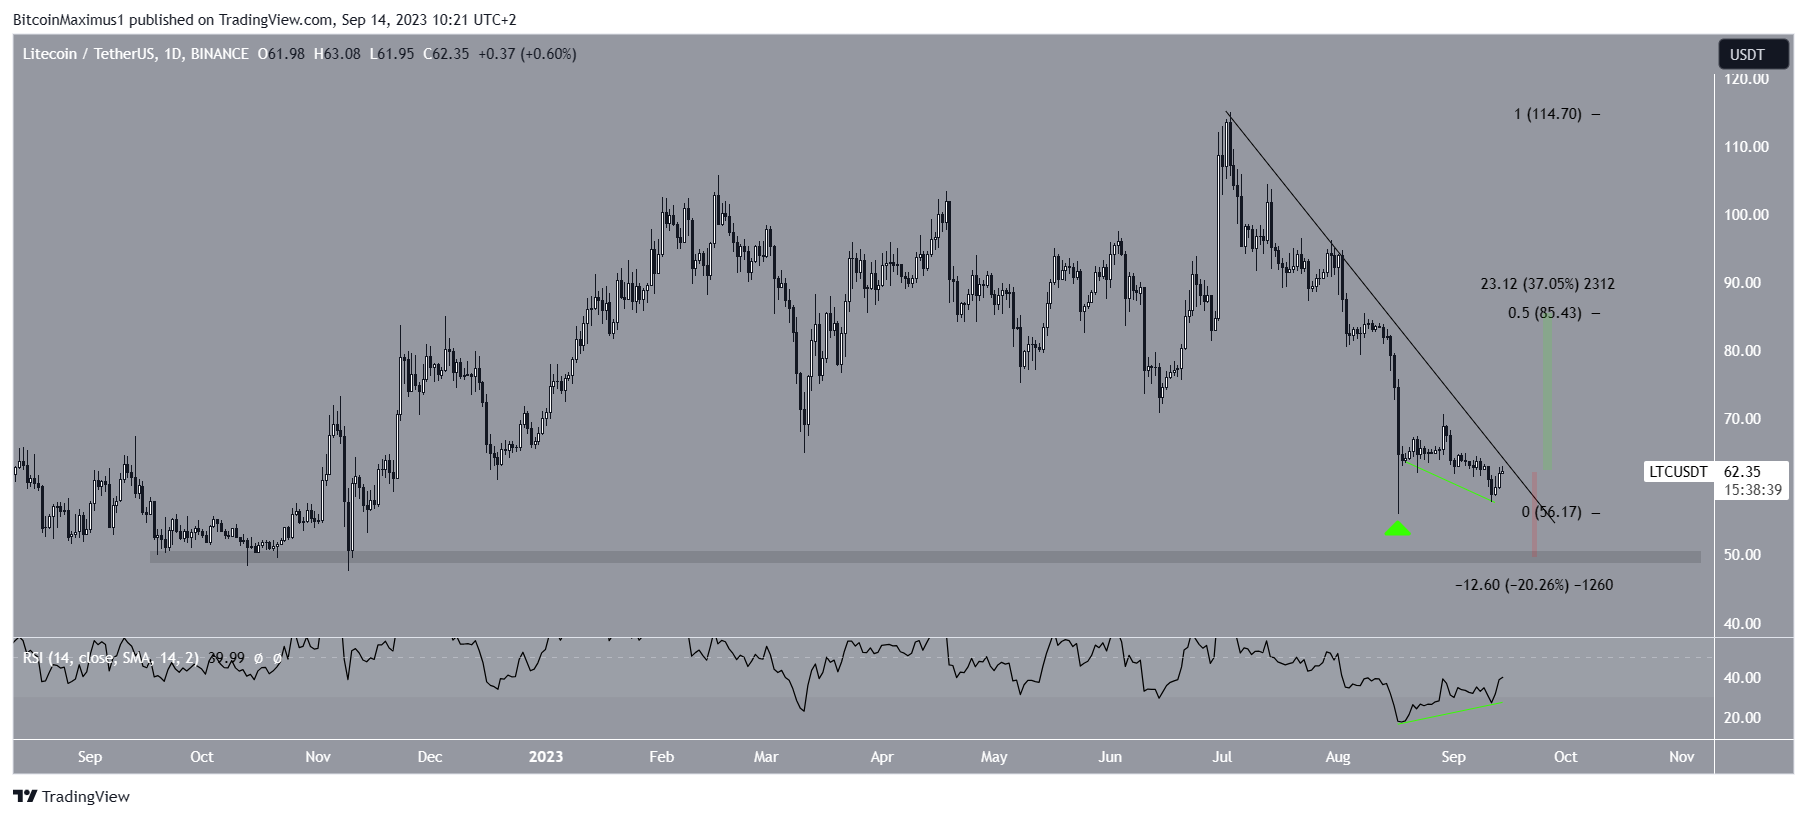
If the cryptocurrency breaks out from the line, it can increase by 37% to the next resistance at $85. The 0.5 Fib retracement resistance level creates the resistance.
On the other hand, failure to break out will likely lead to a 20% drop in the $50 horizontal support area. If the price follows the resistance line, it will reach this area by the beginning of October.
Check Out the Best Upcoming Airdrops in 2023
LiTC Price Prediction: Short-Term Breakout Can Catalyze Long-Term Increase
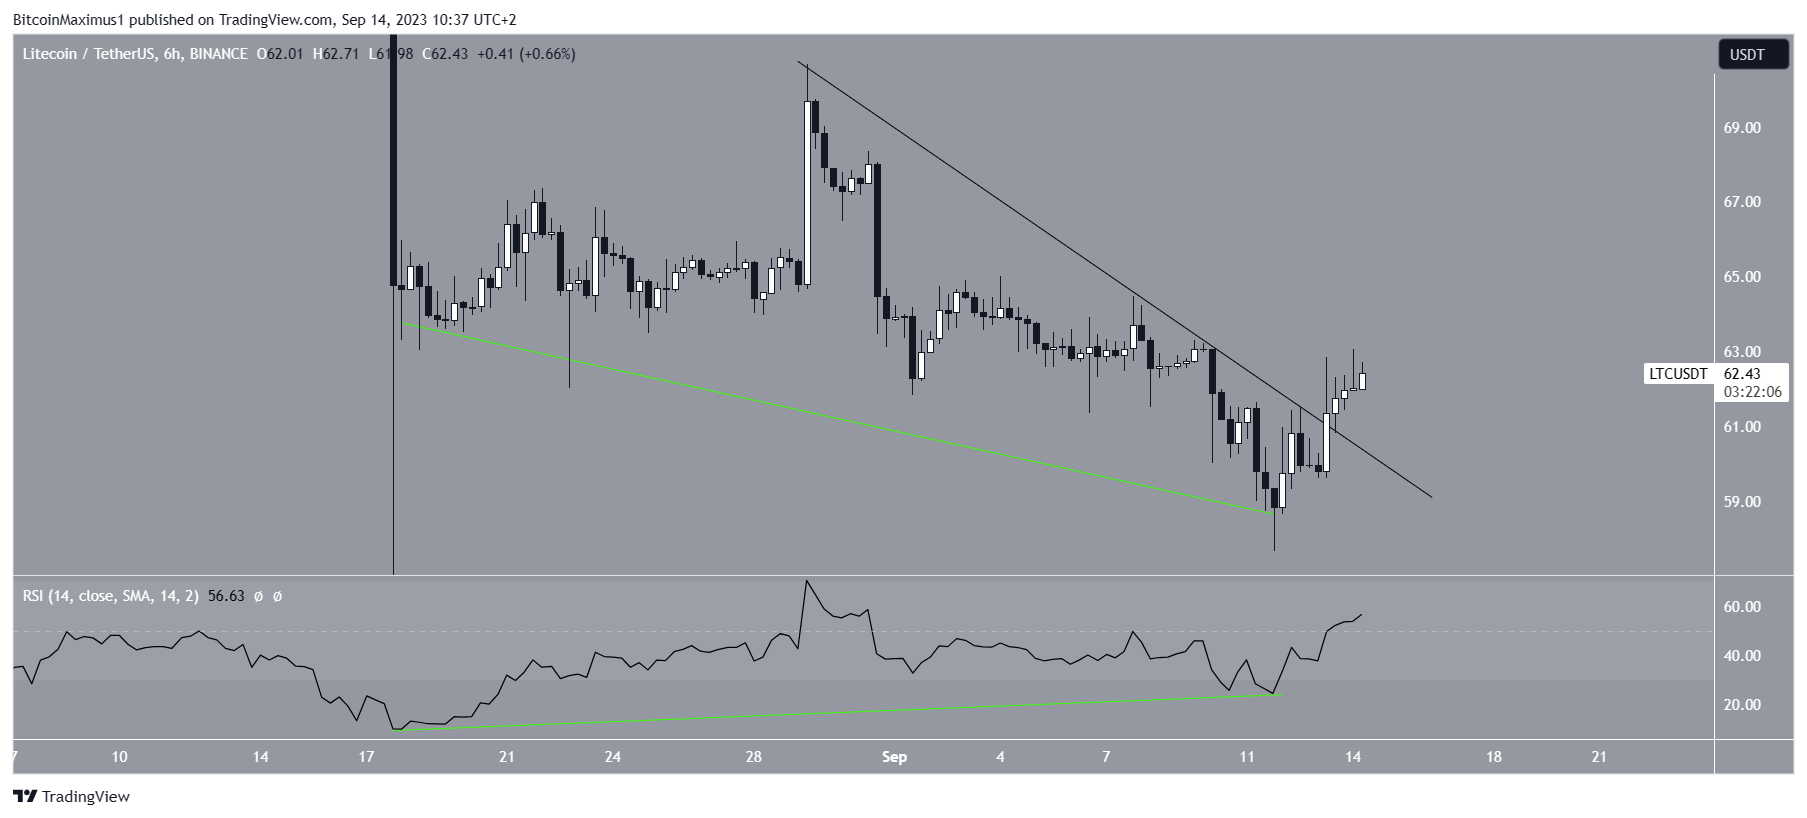
The technical analysis from the six-hour timeframe reiterates the bullish findings from the daily one.
Similarly to the daily timeframe, there is a significant bullish divergence in the six-hour RSI. This supports the creation of a double-bottom pattern and the beginning of a long-term increase. The indicator is above 50, another bullish sign.
Moreover, $LTC has broken out from a short-term descending resistance line. It is possible that this breakout will catalyze a breakout from the long-term descending resistance line, taking the price above the $85 resistance area.
Despite this bullish $LTC price prediction, failure to break out from the long-term descending resistance line will likely lead to a 20% drop to the closest support at $50.