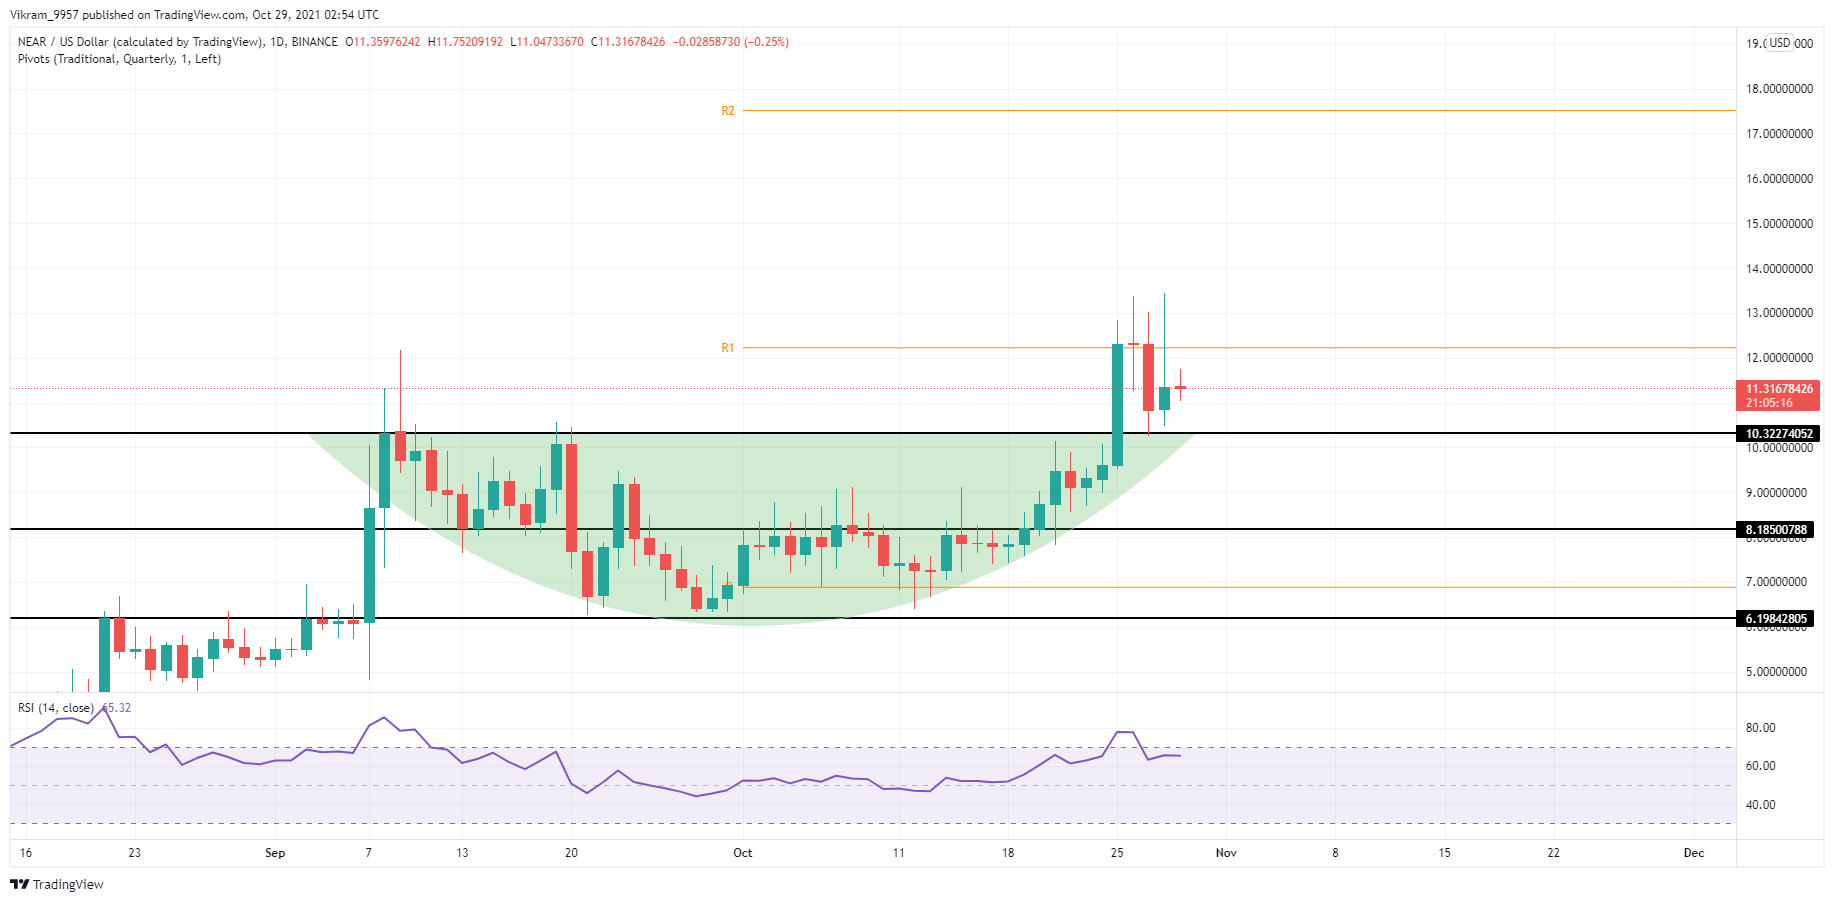
The long wick formation questions the retest of the bullish breakout. Hence, bulls hesitate to enter the NEAR coin price.
Proximity Labs is a research and development company that focuses on the NEAR ecosystem. They are excited to announce the creation of a $350M grants DAO. This DAO will be available for projects, organizations, and individuals who build decentralized finance (Defi) applications on the NEAR Blockchain.
NEAR has seen several projects launch and core infrastructure deployed in the past few weeks. The total value locked (TVL) has surpassed $150M.
Let us now take a look into the technical analysis of NEAR Protocol.
Past Performance of NEAR
With a gain of almost 30% on 25th October, the price forms a bullish engulfing candlestick. As a result, the price breaks above the crucial resistance level of $10 and a rounding bottom pattern.
However, a fall on 27th in the entire crypto-verse affected the NEAR crypto as well. The price action resulted in an evening star pattern. However, upon retest, the price action shows a bullish reversal. However, a weakness in the underlying momentum is evident by the long-wick formation.

Source - Tradingview
NEAR Technical Analysis
At press time, NEAR coin price was trading at $11.32, with a price retracement of 4.99% in the past 24 hours. Furthermore, the trading volume stands at $455 million with a fall of 30% compared to yesterday.
As per the Pivot Points, a bullish breakout of $12.5 uptrend can face resistance at $17.5. In an otherwise situation, $8 can act as a support level followed by the $6 level.
The MACD indicator in the daily chart gives a buy signal. The MACD and the signal lines rise higher with a huge gap indicating strong bullish intentions.
The RSI indicator projects a gradual growth in the slope showing no divergence with the price action. The RSI slope is slightly below the overbought zone implying room for growth. Thus, resulting in a buy signal.
Upcoming Trend
As per the technical analysis of the NEAR Protocol, the coin price is at a very decisive stage. The technical indicators suggest a buy signal, whereas the price action warns of weakness in the underlying momentum.
Hence, traders with bullish intentions can wait till the breakout of the $12 mark.
 cryptoknowmics.com