- 1 XDC Network price (XDC) is up by 6.78% in the last 24 hours and is currently trading at $0.057.
- 2 XDC Network price (XDC) is following a channel pattern and declining.
- 3 XDC Crypto price dropped below the key-moving average of 50-day EMA.
The XDC Network price has shown weakness in recent days and dropped below the key moving average of 50-day EMA indicating the short-term dominance of sellers in the market. Bulls tried to sustain the price above the 50-day EMA but failed.
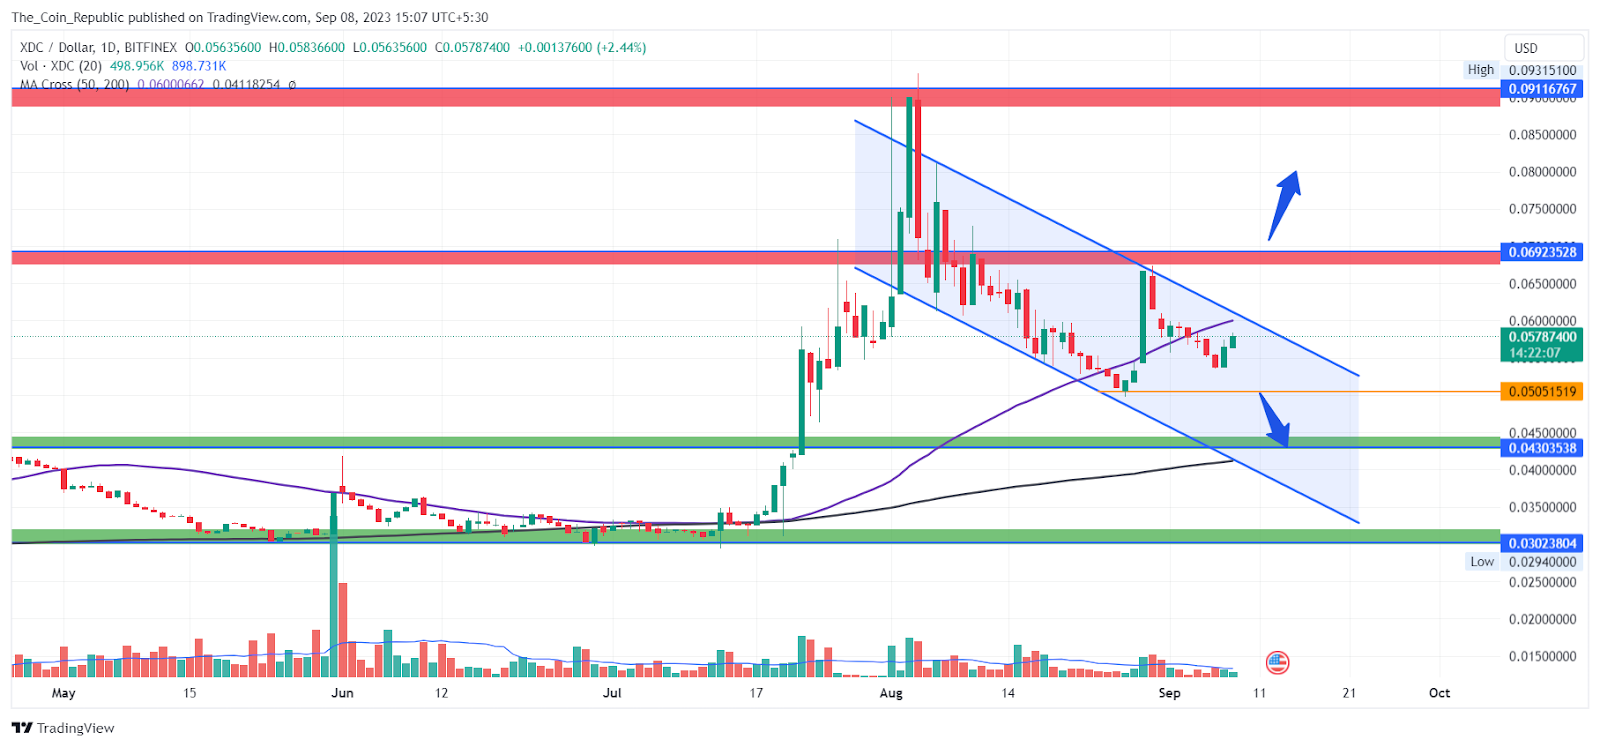
The XDC price showed a sharp upside rally in the 3rd week of July which continued till the 1st week of August 2023. The 3-week rally hiked the price by more than 100% from a low of $0.04 to a high of $0.09.
However, the short-term gain triggered a profit booking among the investors and invited more sellers to enter the market at a premium price. The price showed a continuous decline after forming a bearish price action.
Currently, the price has formed a channel pattern and correcting eroding the short-term gain. The price made a failed attempt to sustain above the 50-day EMA and is currently, declining towards the 200-day EMA.
XDC Network (XDC) is a hybrid blockchain platform that offers transparent, fast, and secure financial services. It uses both public and private networks to combine the best of both worlds. XDC Network was formerly known as XinFin Network.
XDC Network Price Prediction Using Price Action Strategy

Currently, the XDC price slipped below the 50-day EMA indicating the dominance of sellers in the short-term. The price may fall more if it maintains itself in the channel. The price might decline till the 200-day EMA and the recent support zone.
Moreover, the price may show some bullishness if it breaks and manages to sustain above the channel. Also, the volume analysis shows that the volume received is less than the average volume indicating the weakness in the market. The XDC token has received a $8.7 Million volume in the past 24 hours which is nearly 0.20% less than the past day.
XDC Price Forecast from Indicators’ point of view

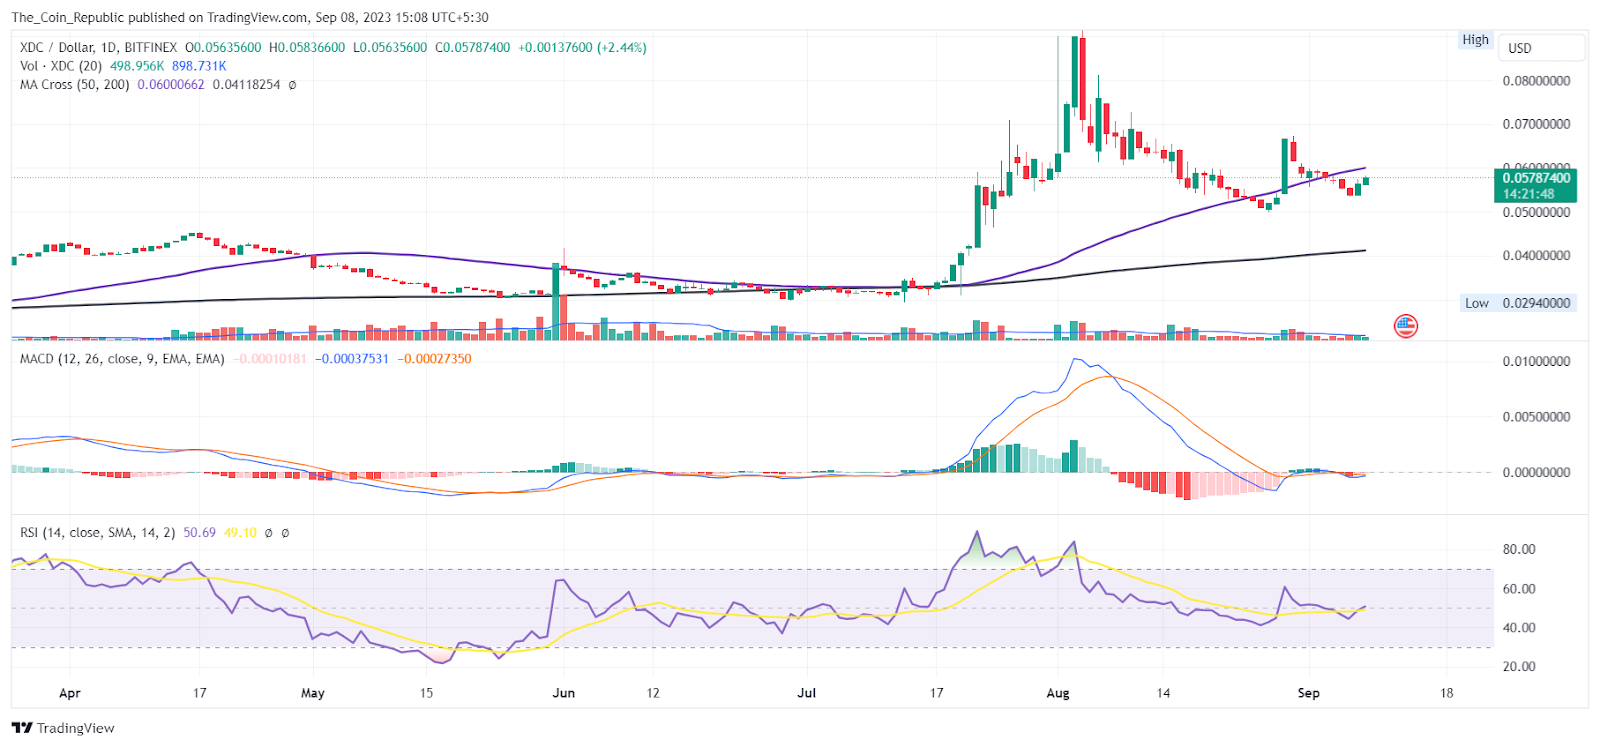
As per the EMA analysis, the XDC price could not sustain above the 50-day EMA indicating the dominance of sellers in the short term. However, the price is still above the 200-day EMA which can be a support to the declining price.
RSI is declining suffering rejection from the SMA line indicating the correction might resume. Also, it is still below the mean line which shows bearishness dominating the charts.
Conclusion
XDC Network (XDC Crypto) is a hybrid blockchain platform that has seen a sharp rise and fall in its price in the last month. The price rallied more than 100% from $0.04 to $0.09 but then declined due to profit booking and selling pressure. The price is now in a channel pattern and below the 50-day EMA, which shows the sellers’ dominance. The price may drop further to the 200-day EMA and the support zone unless it breaks above the channel. The volume is also low, indicating weakness in the market.
Technical Levels
- Support levels: $0.04 and $.032.
- Resistance levels: $0.069 and $0.091.
Disclaimer
The views and opinions stated by the author, or any people named in this article, are for informational purposes only and do not establish financial, investment, or other advice. Investing in or trading crypto or stock comes with a risk of financial loss.
 thecoinrepublic.com
