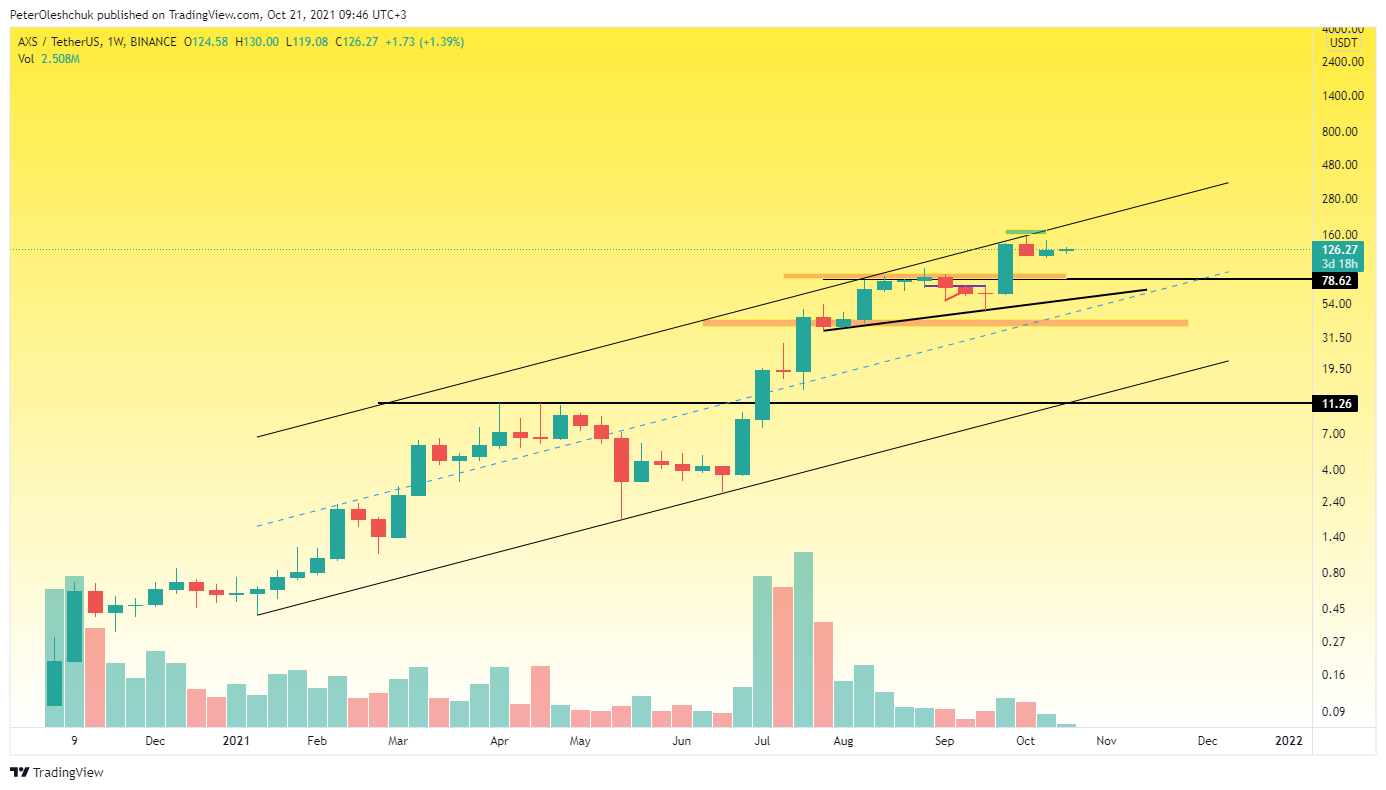
The month of October in the AXS market is spent waiting for the truth and finding compromises between traders. After a phenomenal weekly growth of AXS prices on 27 September, the market stopped to recharge. This is logical, because in just one week, the AXS price rose by 100% and tested the upper trend line of the global growth channel. Keeping the AXS price in a relatively narrow consolidation suggests that buyers still have enough strength to continue the growth wave. However, this takes a little longer to consolidate AXS price to completely deplete sellers.
https://www.tradingview.com/x/9dSdqmDM/
In addition, to accelerate the growth trend and breakdown the upper trend line requires a lot of resources in the form of trading volumes. And as we see in the weekly timeframe, even the growth on 27 September did not occur at any increased volumes. If we compare them with the trading volumes in July 2021, it becomes clear that now the price is moving by inertia. This fact makes you think about what will happen if the Bitcoin market begins its correction? Given the frantic volatility of the AXS cryptocurrency, the price fall with the first target of $78 will not break the main trend of buyers at all, but will only allow them to be tested for strength.
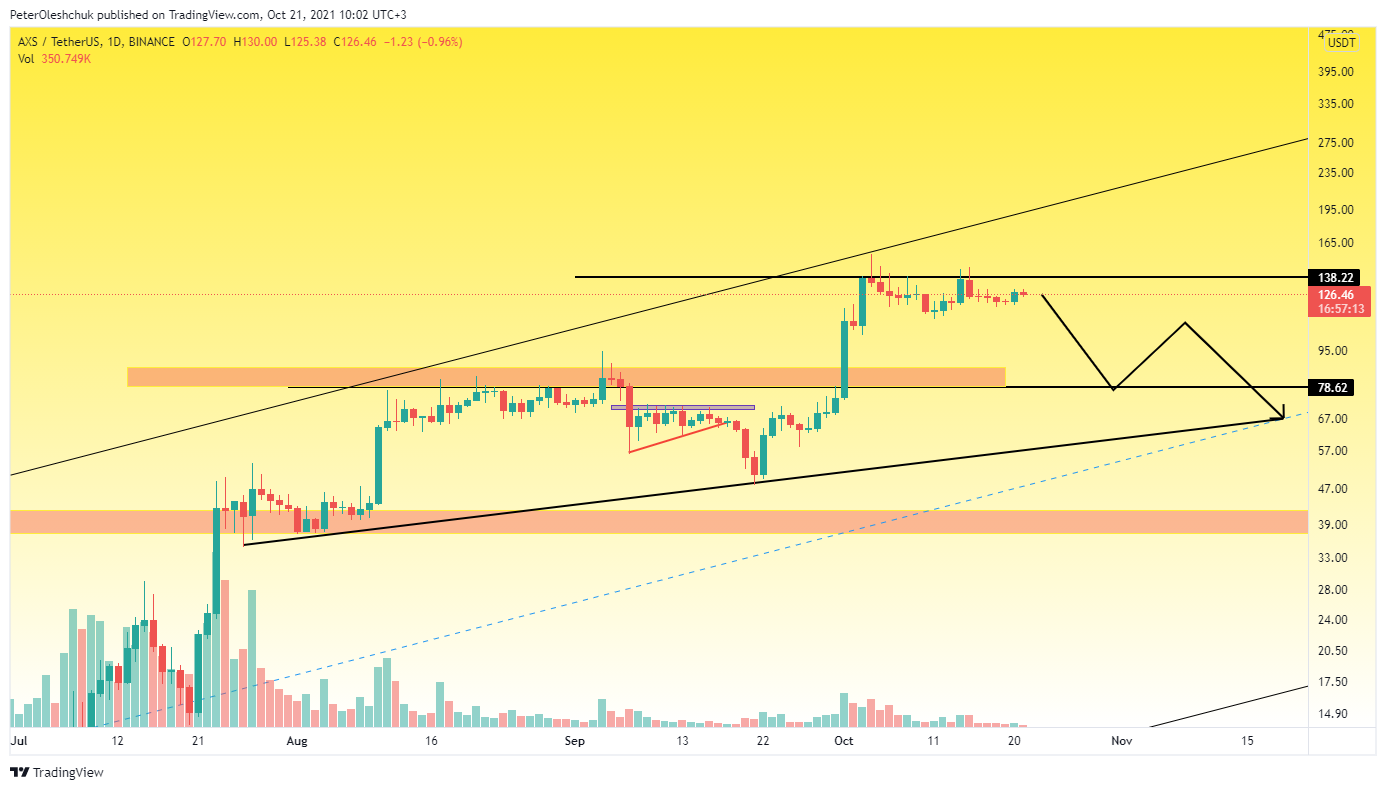
AXS Technical Analysis in the Daily Timeframe
https://www.tradingview.com/x/B0NRbeFm/
Analyzing the daily timeframe, you can see that sellers are starting to become more active after a false break of the $138.22 mark. On the chart, we see that twice buyers have tried to take control of this price level, after which a local fall wave began. However, after the first test of the $138.22 mark, the sellers behaved as aggressively as possible in terms of trading volumes, the attempt to fall on 15 October was already at low volumes. The scenario of a protracted correction and the AXS market will be possible after breaking the price of $120 in this case, we will see a rather sharp fall wave, which in the long run may go below $78.
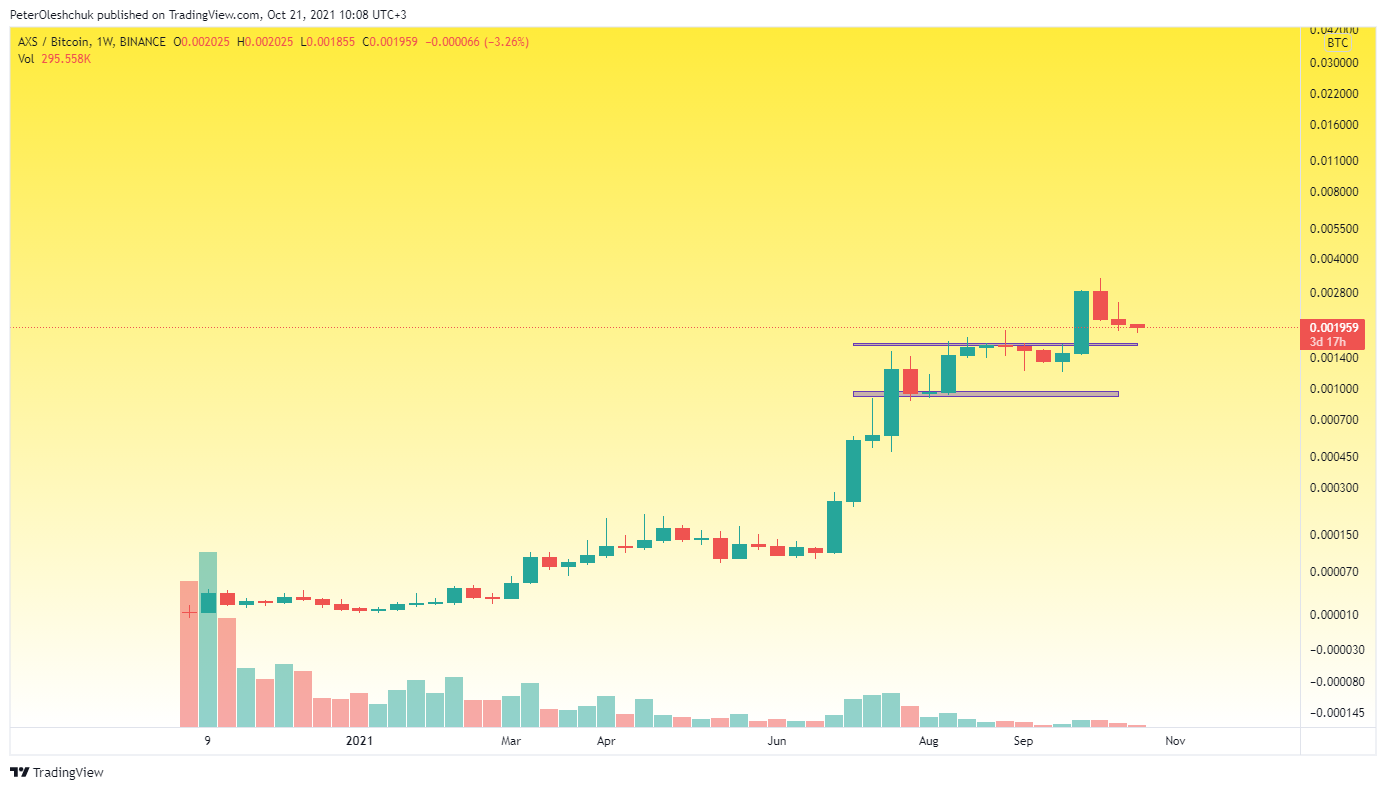
AXSBTC Price Has the Prospect of Falling at Least 15%
https://www.tradingview.com/x/t6gj9xqg/
The probability of another fall wave in the AXS market is indicated by the AXSBTC price chart. As we can see in the chart, the price has been falling systematically for the third week in a row and has every chance of reaching 0.0016. This mark inhibited the growth of AXS for 10 weeks. Therefore, checking the strength of this mark is a sacred task for sellers. If buyers keep the mark of 0.0016 then you can confidently buy AXS with low risks in the medium term. However, now it is worth waiting for the end of October and the response of sellers to update the historical high of BTC.